
Using FlexPivotChart with FlexGrid and FlexChart
The new FlexPivotChart control lets you use the FlexChart control within C1FlexPivot for impeccable data analysis. In this walkthrough, we utilize a scenario where a user wants to analyze the sales and expense data of products across different countries. The FlexPivotPage and FlexPivotChart classes are used in this application along with FlexChart and FlexGrid controls to produce the desired visual data analysis.
With the help of this walkthrough, you will learn how to:
Show multiple Series and secondary axis in FlexPivotChart element .
Modify tooltips for FlexPivotChart element.
Show details for selected data point in the FlexPivotChart using FlexGrid control.
Show multiple Series and secondary axis in FlexPivotChart element
Initialize the FlexPivotPage and FlexGrid controls.
// Initialize Form
flexPivotPage = new FlexPivotPage();
flexPivotPage.Height = 440;
flexPivotPage.Dock = DockStyle.Top;
this.Controls.Add(flexPivotPage);
lbl = new Label() {
    Text = "Selected Country details", TextAlign = ContentAlignment.MiddleCenter,
    Dock = DockStyle.Bottom, Visible =false };
this.Controls.Add(lbl);
detailGrid = new C1FlexGrid();
detailGrid.Dock = DockStyle.Bottom;
detailGrid.Height = 60;
detailGrid.Visible = false;
this.Controls.Add(detailGrid);
selectedCountryData = new ObservableCollection<Country>();
detailGrid.DataSource = selectedCountryData;
Add Data Source, RowFields and ValueFields to the FlexPivotPage control. Set the Chart type for FlexPivotChart control and get the series collection for FlexChart control.
// sets FlexPivot DataSource and other fields
flexPivotPage.DataSource = GetCountrySales();
flexPivotPage.FlexPivotEngine.ValueFields.Add("Sales");
flexPivotPage.FlexPivotEngine.ValueFields.Add("Expenses");
flexPivotPage.FlexPivotEngine.RowFields.Add("Name");
// Define FlexPivotChart settings for handling chart's series, tooltips and data points' details
// sets FlexPivotChart type
flexPivotPage.FlexPivotChart.ChartType = ChartType.Line;
// sets whether to place series above/side-by-side
flexPivotPage.FlexPivotChart.Stacked = false;
// gets FlexChart component from FlexPivot's new API FlexPivotChart
var flexChart = flexPivotPage.FlexPivotChart.Chart as FlexChart;
if(flexChart!=null)
{
// gets FlexChart's Series collection
var seriesColl = flexChart.Series as ObservableCollection<Series>;
seriesColl.CollectionChanged += SeriesColl_CollectionChanged;
}
// enables data point selection in FlexChart (to get associated details for its data point)
flexChart.SelectionMode = C1.Chart.ChartSelectionMode.Point;
flexChart.SelectionChanged += FlexChart_SelectionChanged;
// handles FlexChart's mouse move event (to modify its ToolTip)
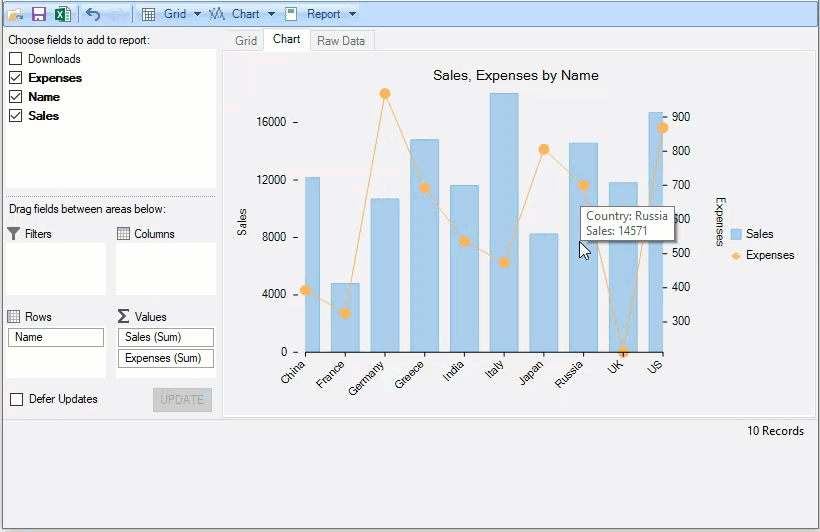
flexChart.MouseMove += Chart_MouseMove;In this walkthrough, we have added two series of charts, 'Sales' and 'Expenses'. The Sales series is a Column chart type and the Expenses series is Line chart type. There are two axes in this series collection, one plotted across the left and the other towards the right. A secondary chart axis is useful when the user wants to show the values for more than one data series. The secondary axis is apt in this scenario as we have used a combination of column and line charts.
// Modify individual FlexChart Series
private void SeriesColl_CollectionChanged(object sender, System.Collections.Specialized.NotifyCollectionChangedEventArgs e)
{
    // handle only if a Series is added to FlexChart
    if (e.Action== System.Collections.Specialized.NotifyCollectionChangedAction.Add)
    {
        var series = e.NewItems[e.NewItems.Count - 1] as Series;
        if (series == null)
            return;
        switch(series.Name)
        {
            case "Sales":
                series.ChartType = C1.Chart.ChartType.Column;
                series.AxisY = new Axis()
                {
                    AxisLine = false,
                    Position = C1.Chart.Position.Left,
                    Title = "Sales"
                };
                break;
            case "Expenses":
                series.ChartType = C1.Chart.ChartType.LineSymbols;
                series.AxisY = new Axis()
                {
                    AxisLine = false,
                    Position = C1.Chart.Position.Right,
                    Title = "Expenses"
                };
                break;
        }
    }
    else
    {
        // hides all controls except FlexPivotPage
        detailGrid.Visible = false;
        lbl.Visible = false;
    }
}
Modify tooltips for FlexPivotChart element
If a user wants to show information about country-specific sales or expenses, it can be set using the ToolTip property of the FlexChartBase class, which provides information about the 'Country' (AxisX label) and data specific to the series 'Sales' or 'Expenses'. The information about a specific data point on a Series chart is provided using the HitTest method of FlexChart class.
// Modify FlexChart ToolTips
private void Chart_MouseMove(object sender, MouseEventArgs e)
{
   var chart = sender as FlexChart;
   // gets element under mouse pointer
    var hitTestInfo = chart.HitTest(e.Location);
   if (hitTestInfo == null || hitTestInfo.Item == null)
       return;
   if (hitTestInfo.Item != null && hitTestInfo.Distance <= 3)
   {
       // gets country name (AxisX label) specific to the mouse pointer
        var country = ((List<string>)chart.AxisX.DataSource)[hitTestInfo.PointIndex];
       // modify FlexChart tooltip value/content
        chart.ToolTip.Content = String.Format("Country: {0}\n{1}: {2}", country, hitTestInfo.Series.Name, hitTestInfo.Y);
   }
}
Show details for selected data point in the FlexPivotChart using FlexGrid control
In the application, the user can select a chart element, and get the details for the selected element in the FlexGrid. The ChartSelectionMode enumeration enables data point selection in FlexChart to get the associated details for each data point.
// Get Details For Selected FlexChart Element
private void FlexChart_SelectionChanged(object sender, EventArgs e)
{
    var chart = sender as FlexChart;
    if (chart != null && chart.SelectedIndex > -1)
    {
        // enables controls for showing selected element details
        detailGrid.Visible = true;
        lbl.Visible = true;
        // get details for selected element
        Country selectedCountry = (((chart.Parent as FlexPivotChart).DataSource as C1FlexPivotPanel).DataSource as List<Country>).OrderBy(c => c.Name).ToList()[chart.SelectedIndex] as Country;
        if(selectedCountry!=null)
        {
            selectedCountryData.Clear();
            selectedCountryData.Add(selectedCountry);
            detailGrid.DataSource = selectedCountryData.ToList();
        }
    }
    else
    {
        // hides all controls except FlexPivotPage
        detailGrid.Visible = false;
        lbl.Visible = false;
    }
}