FlexPivotPage
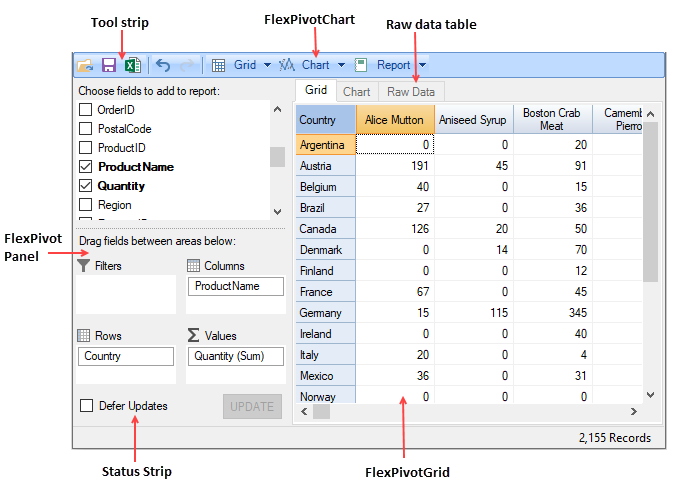
FlexPivotPage provides a complete interface for building FlexPivot applications. It combines C1FlexPivotPanel with tabbed views for displaying summarized data as a grid, chart, or raw data, together with a tool strip that provides common analysis and reporting commands.
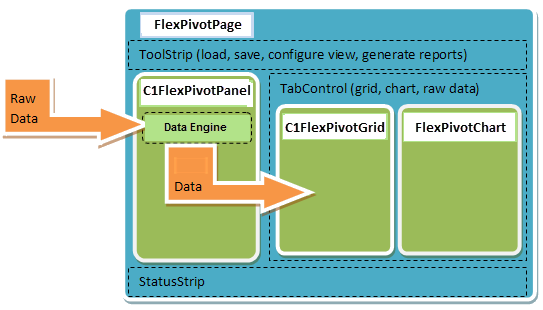
The FlexPivotPage object model exposes the integrated controls, enabling interface customization and extension.
Grid Menu
The Grid menu provides options for configuring the appearance and behavior of the pivot grid.
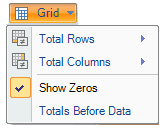
Total Rows | Allows selection of Grand Totals, Subtotals, or None. |
|---|---|
Total Columns | Allows selection of Grand Totals, Subtotals, or None. |
Show Zeros | Enable to display cells that contain zero values. |
Totals Before Data | Add a total row or column before the data. |
Disable these options to hide totals or cells containing zero values.
Chart Menu
The Chart menu provides options for selecting chart types and configuring chart appearance, including color palettes, titles, stacking, gridlines, and totals.
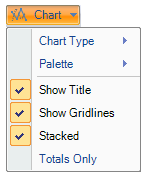
Chart Type | Click Chart Type to select one of five chart types. |
|---|---|
Palette | Select Palette to choose from 16 predefined color palettes for the chart and legend items. |
Show Title | When enabled, a title appears above the chart. |
Stacked | When enabled, the chart displays stacked data. |
Show Gridlines | When enabled, gridlines appear in the chart. |
Totals Only | When enabled, the chart displays totals instead of separate series for each column in the data source. |
Chart Types
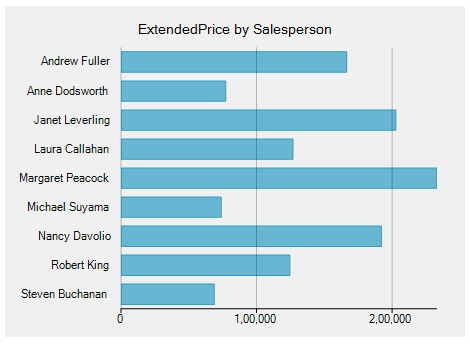
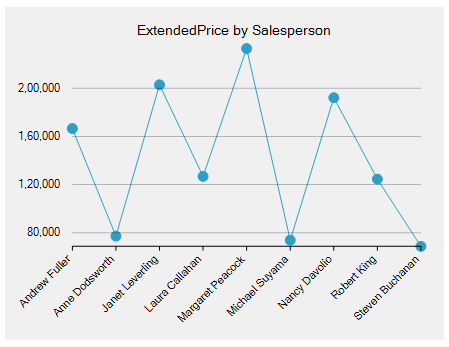
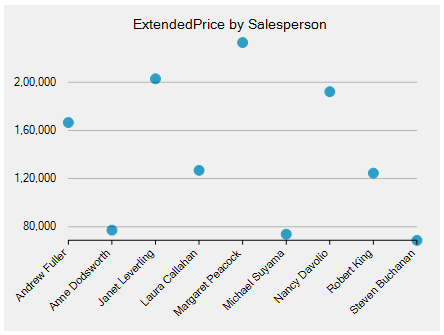
FlexPivot supports multiple chart types for visualizing summarized data.
Report Menu
The Report menu provides commands for previewing, printing, and configuring reports generated from FlexPivot data.
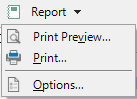
The following table describes the available Report commands.
Print Preview | Click Print Preview to preview the report before printing or to export it as a PDF file. |
|---|---|
Click Print to print the C1FlexPivotGrid, FlexPivotChart, or both. | |
Options | Click Options to open the Document Options dialog box. |
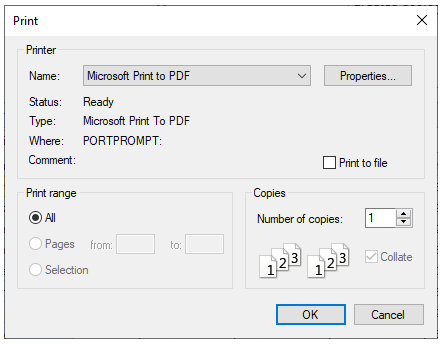
The Print command opens the Print dialog box and allows printing using available printers, including Microsoft Print to PDF.
Document Options
Page Tab
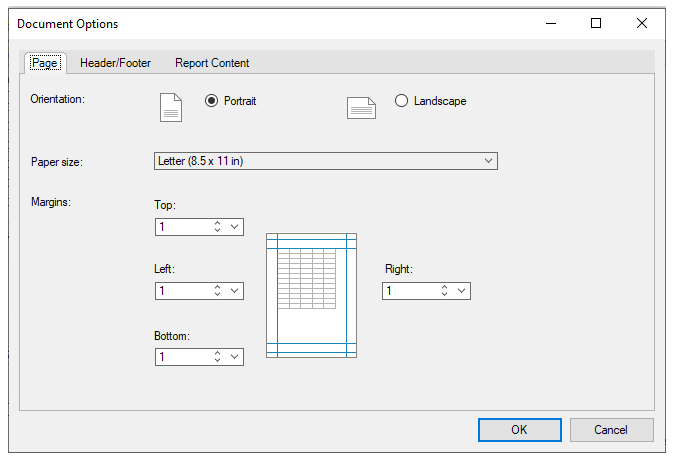
The Page tab configures page layout settings, including page orientation, paper size, and margins.
Header/Footer Tab
The Header/Footer tab adds headers and footers to printed reports. Toolbar buttons insert dynamic fields such as page numbers, dates, document names, and user information.
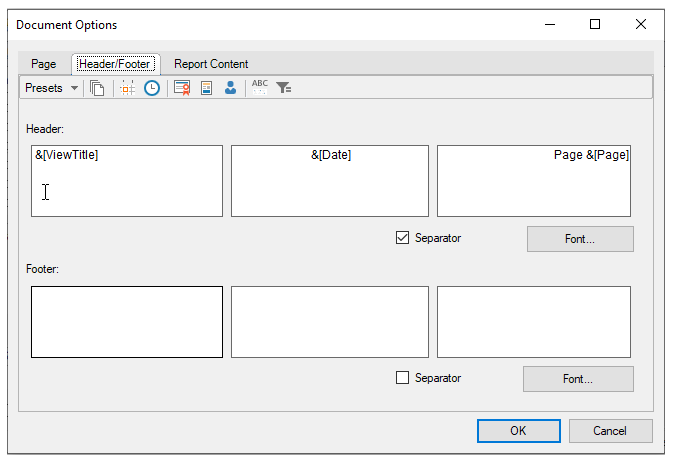
Click a toolbar button to insert a field into the header or footer.
Button | Field |
|---|---|
Presets | Select one of three predefined options that insert grouped fields into the header or footer. |
Page Number | &[Page] |
Current Date | &[Date] |
Current Time | &[Time] |
Document Name | $[DocName] |
View Description | &[ViewTitle] |
Author Name | &[UserName] |
Enable Separator to display a separator line below the header or above the footer. Select Font to modify the font, style, size, or effects.
Report Content Tab
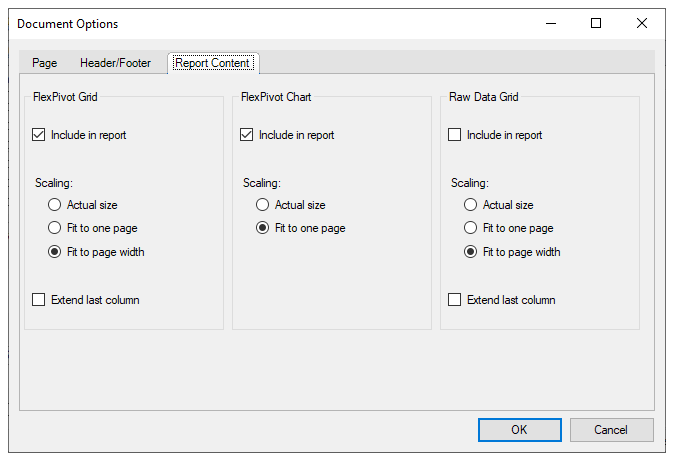
The Report Content tab specifies whether the report includes the pivot grid, chart, raw data, or a combination of these elements.