
Manage Overlapping Data Labels
Overlapping of data labels is one of the most comment issues pertaining to charts. Overlapping, generally, occurs due to long data label text or a large number of data points plotted on a chart. With FlexChart, you get many options to manage your data labels. You can choose any of them according to the chart data and your requirement.
Auto-arrange Data Labels
Allowing FlexChart to arrange the data labels automatically according to the available real estate is the most convenient way of handling overlapping data labels. This can be done by setting the Position property of DataLabel class to Auto. Not just this, FlexChart also provides MaxAutoLabels property so that you can set maximum number of data labels that FlexChart can position automatically. The default value of MaxAutoLabels property is 100 which means FlexChart creates maximum 100 data labels in a chart.
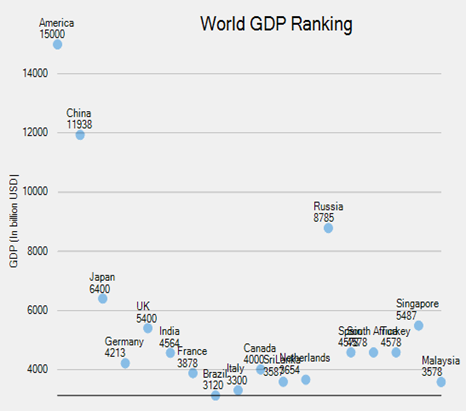
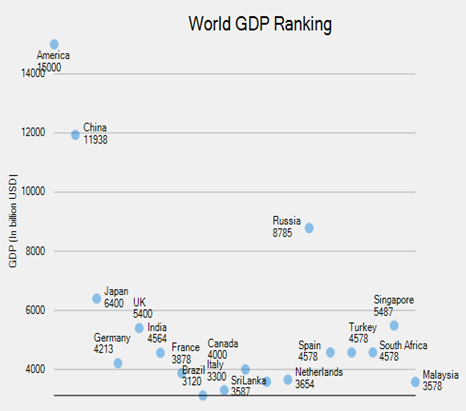
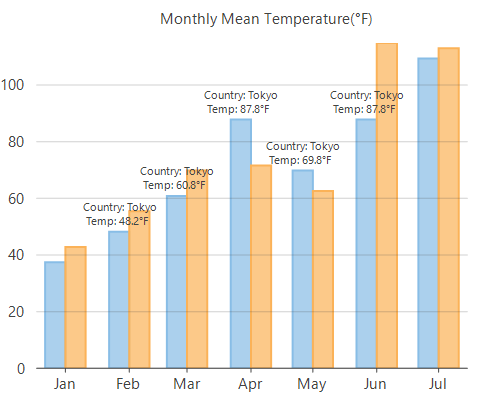
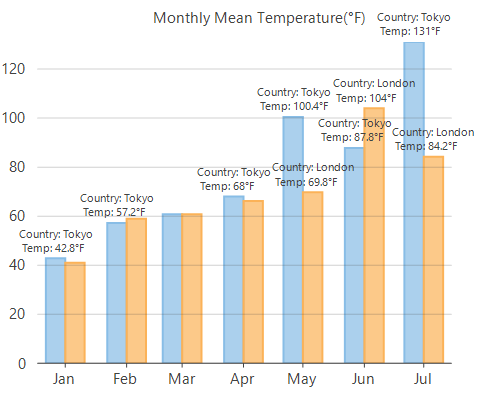
LabelPosition.Top | LabelPosition.Auto |
|---|---|
|
|
Note that increasing the value of MaxAutoLabels property to a value more than 100 may result in slow rendering of FlexChart as the label positioning algorithm becomes expensive in terms of performance when number of data labels is large. Hence, auto-arrangement of data labels may not be an optimal solution when the number of data labels is too large to fit in the available space. In such case, it is recommended to reduce the number of data labels by hiding them at individual series level.
//Set position of data labels
  this.flexChart1.DataLabel.Position = LabelPosition.Top;
'Set position of data labels
Me.flexChart1.DataLabel.Position = LabelPosition.TopHide Overlapped Data Labels
FlexChart provides an option to show or hide the overlapped data labels by setting the Overlapping property of DataLabel class. This property accepts the values from LabelOverlapping enumeration.
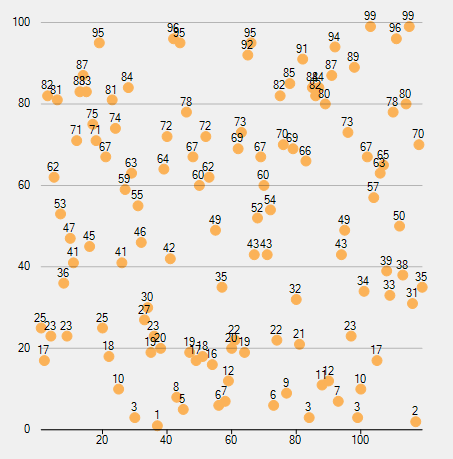
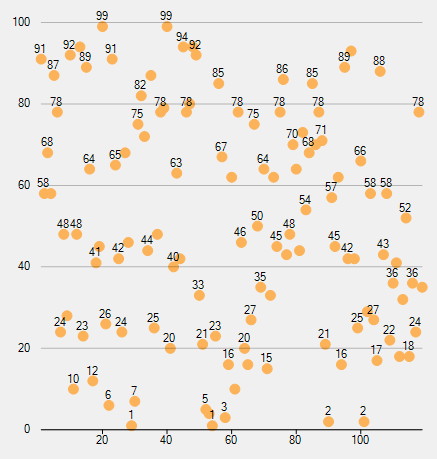
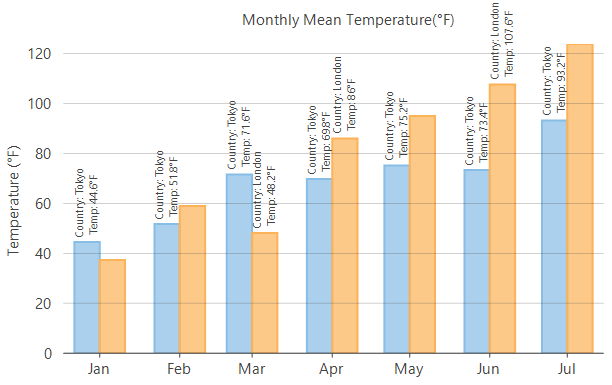
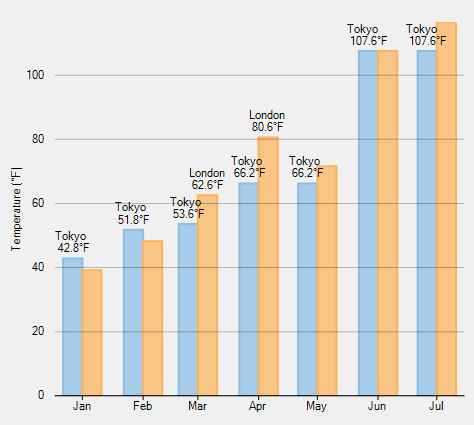
LabelOverlapping.Show | LabelOverlapping.Hide |
|---|---|
|
|
//Hide the overlapping data labels
   this.flexChart1.DataLabel.Overlapping = LabelOverlapping.Hide;
' Hide the overlapping data labels
Me.flexChart1.DataLabel.Overlapping = LabelOverlapping.HideIn case of pie chart and sunburst chart, you can use the Overlapping property of the PieDataLabel class which accepts the values from PieLabelOverlapping enumeration. This property lets you choose to show the data labels, by default, but hides or trims the data labels when label text is larger than the corresponding pie segment.
PieLabelOverlapping.Default | PieLabelOverlapping.Hide | PieLabelOverlapping.Trim |
|---|---|---|
|
|
|
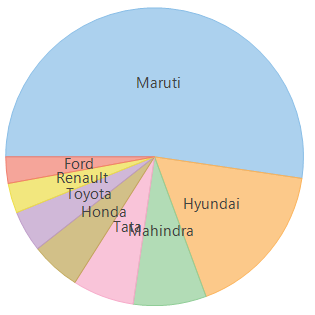
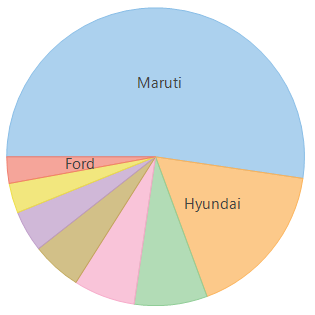
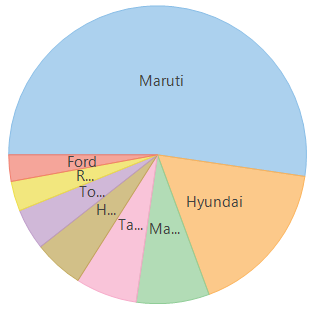
//Hide the overlapping data labels
   this.flexPie1.DataLabel.Overlapping = PieLabelOverlapping.Hide;
' Hide the overlapping data labels
Me.flexPie1.DataLabel.Overlapping = PieLabelOverlapping.HideCustomize Pie Chart Data Label Positioning
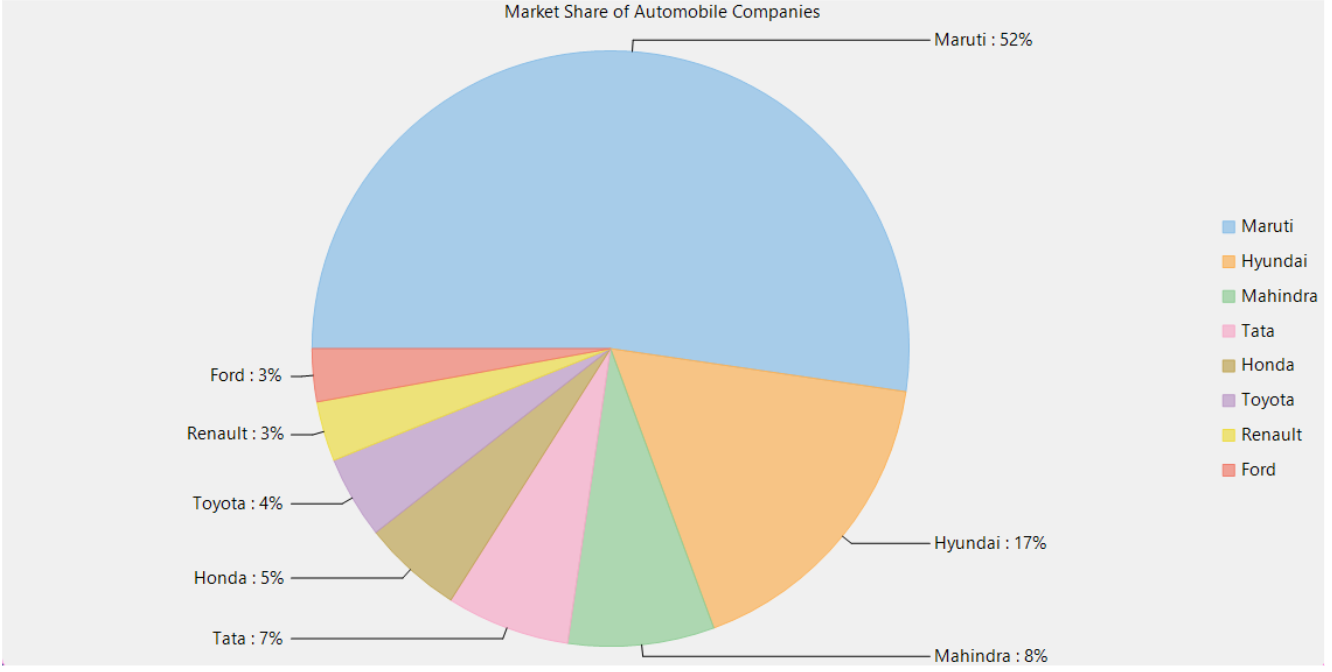
Flex Pie allows users to customize the data label using the ‘Sides' option from the PieLabelPosition property. The labels are distanced equally from the center, giving the chart a cleaner look.
Packages Required
C1.Chart - 8.0.20252.34
C1.Win.FlexChart - 8.0.20252.715
To create customized data label, use the following code
flexPie1.DataLabel.Position = PieLabelPosition.Sides; Sample Usage
using C1.Chart;
using C1.Win.Chart;

namespace FlexPie_LabelPositionSides
{
    public partial class Form1 : Form
    {
        public Form1()
        {
            InitializeComponent();
        }

        private void Form1_Load(object sender, EventArgs e)
        {

            FlexPie flexPie1 = new FlexPie();
            //Binding FlexPie's AxisX to 'Value' so values appear in Horizontal axis
            flexPie1.Binding = "Value";

            flexPie1.BindingName = "Name";

            //Specify what and how to show data values
            flexPie1.DataLabel.Content = "{name} : {p:0}%";

            //Dock the FlexPie to fill the application window
            flexPie1.Dock = DockStyle.Fill;

            //Setting FlexPie's Header
            flexPie1.Header.Content = "Market Share of Automobile Companies";

            //Specify where to position the data labels relative to pie slices
            //!!! This is the new option for data label positioning
            flexPie1.DataLabel.Position = PieLabelPosition.Sides;

            //Passing data in FlexPie
            flexPie1.DataSource = GetCarSales();

            //Adding FlexPie to the Form
            this.Controls.Add(flexPie1);
        }

        //Method to create data for FlexPie
        public static List<CategoricalPoint> GetCarSales()
        {
            var data = new List<CategoricalPoint>()
        {
            new CategoricalPoint{Name="Maruti", Value=1643467},
            new CategoricalPoint{Name="Hyundai", Value=536241},
            new CategoricalPoint{Name="Mahindra", Value=248859},
            new CategoricalPoint{Name="Tata", Value=210200},
            new CategoricalPoint{Name="Honda", Value=170026},
            new CategoricalPoint{Name="Toyota", Value=140645},
            new CategoricalPoint{Name="Renault", Value=102222},
            new CategoricalPoint{Name="Ford", Value=90061},
        };
            return data;
        }


        //Data model class to hold data for FlexPie
        public class CategoricalPoint
        {
            public string Name { get; set; }
            public int Value { get; set; }
        }

    }
}
Control Appearance of Overlapped Data Labels
Apart from the options discussed above, you can further refine the settings to manage the overlapping data labels more effectively. You can do this by setting the OverlappingOptions property which accepts the values from LabelOverlappingOptions enumeration. The property gives you options to avoid overlapping completely, allow data labels to overlap with data points or allow them to display outside plot area.
LabelOverlappingOptions.None | LabelOverlappingOptions.OutsidePlotArea |
|---|---|
|
|
//Allow to display the data labels outside plot area
   this.flexChart1.DataLabel.OverlappingOptions = LabelOverlappingOptions.OutsidePlotArea;
' Allow to display the data labels outside plot area
Me.flexChart1.DataLabel.OverlappingOptions = LabelOverlappingOptions.OutsidePlotAreaRotate Data Labels
FlexChart allows you to rotate the data labels using the Angle property of DataLabel class which reduces the chances of overlapping data labels. This property accepts a value between 0 to 90 in degrees.
//Rotate the data labels by 90 degrees
    this.flexChart1.DataLabel.Angle= 90;
' Rotate the data labels by 90 degrees
Me.flexChart1.DataLabel.Angle= 90 Trim Or Wrap Data Labels Text
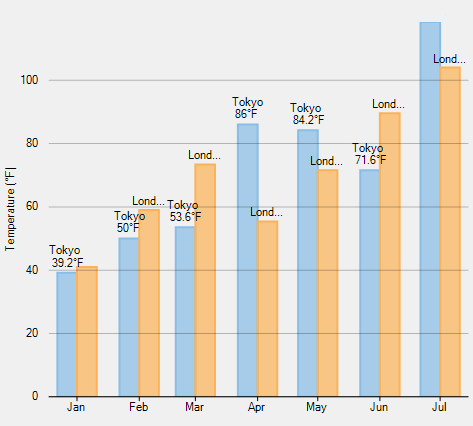
Another option that FlexChart provides to manage the overlapping of data labels is trimming or wrapping of the data label text if it exceeds a specified character limit or line limit. You can specify whether to trim or wrap the text by setting the ContentOptions property. You can specify the maximum width of data label text after which FlexChart should wrap or trim the text by setting the MaxWidth property. In case of wrapping the text, you can limit the wrapped text to grow vertically by specifying the maximum number of lines until which the data labels should be wrapped. To indicate that the further text is trimmed, FlexChart displays an ellipsis at the end of the data label text if it exceeds the limit defined by the MaxWidth and MaxLines property.
ContentOptions.None | ContentOptions.Trim |
|---|---|
|
|
// Trim the data labels if they exceed the maximum width
     this.flexChart1.DataLabel.ContentOptions = ContentOptions.Trim;
this.flexChart1.DataLabel.MaxWidth = 40;
' Trim the data labels if they exceed the maximum width
Me.flexChart1.DataLabel.ContentOptions = ContentOptions.Trim
Me.flexChart1.DataLabel.MaxWidth = 40