
Ranged Histogram Chart
Ranged histogram is a modern Excel-like histogram chart that helps visualize frequency distribution on Y-axis, against ranged X-axis. Like histogram chart type, bins are created by dividing the raw data values into a series of consecutive, non-overlapping intervals. Based on the number of values falling in a particular bin or category, frequencies are then plotted as rectangular columns against X-axis. FlexChart lets you render the ranged histogram in non-category or category mode depending on what do you want to display on the X-axis.
Ranged Histogram in Non-category Mode | Ranged Histogram in Category Mode |
|---|---|
|
|
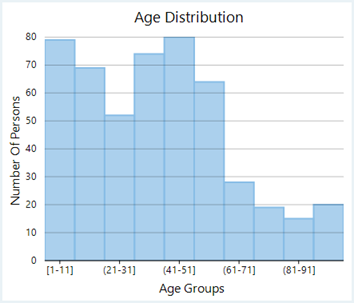
Non-category Mode
In non-category mode, the original data points are binned into intervals or ranges. For instance, the age distribution of a population plotted against age divided into various ranges is one good example of histogram in non-category mode.
With FlexChart, you can create a WinForms ranged histogram in non-category mode by setting the ChartType property to RangedHistogram and adding a RangedHistogram series to the chart. Once data is provided, FlexChart automatically calculates the bins to group the data and create a ranged histogram. However, you can also choose whether you want to render the chart with a specified bin width or a specified bin count by setting the BinMode property which accepts the values from HistogramBinning enumeration. You can further set BinWidth, NumberOfBins, UnderflowBin, OverflowBin and can even specify whether to ShowUnderflowBin and ShowOverflowBin in the ranged histogram.
// clear data series collection
flexChart1.Series.Clear();
// setting ChartType to RangedHistogram
flexChart1.ChartType = ChartType.RangedHistogram;
// create and add RangedHistogram type series
_rangedHistoSeries = new C1.Win.Chart.RangedHistogram();
_rangedHistoSeries.BindingX = "";
_rangedHistoSeries.Binding = "Age";
flexChart1.Series.Add(_rangedHistoSeries);
// specify the datasource for the chart
this.flexChart1.DataSource = GetAgeData();
// setting Axis titles
this.flexChart1.AxisX.Title = "Age Groups";
this.flexChart1.AxisY.Title = "Number Of Persons";
' Method for initializing FlexChart
Protected Sub SetupChart()
flexChart1.BeginUpdate()
#Region "SetupChart"
' clear data series collection
flexChart1.Series.Clear()
' setting ChartType to RangedHistogram
flexChart1.ChartType = ChartType.RangedHistogram
' create and add RangedHistogram type series
_rangedHistoSeries = New C1.Win.Chart.RangedHistogram()
_rangedHistoSeries.BindingX = ""
_rangedHistoSeries.Binding = "age"
flexChart1.Series.Add(_rangedHistoSeries)
' specify the datasource for the chart
Me.flexChart1.DataSource = GetAgeData()
' setting Axis titles
Me.flexChart1.AxisX.Title = "Age Groups"
Me.flexChart1.AxisY.Title = "Number Of Persons"Category Mode
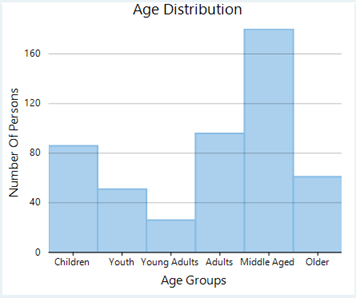
In category mode, frequency data is exclusively grouped in categories (which are plotted on X-axis) as provided by the original data and Y-axis depicts cumulative frequency for the respective categories. For instance, the age distribution of a population can also be plotted by dividing the data into age groups as shown in the image above.
In FlexChart, you need to set the ChartType property to RangedHistogram, add a RangedHistogram series to the chart and set the BindingX property to enable the category mode. After this, properties such as BinMode, BinWidth, NumberOfBins, OverflowBin, and UnderflowBin are ignored.
// clear data series collection
flexChart1.Series.Clear();
// setting ChartType to RangedHistogram
flexChart1.ChartType = ChartType.RangedHistogram;
// create and add RangedHistogram type series
_rangedHistoSeries = new C1.Win.Chart.RangedHistogram();
_rangedHistoSeries.BindingX = "AgeGroup";
_rangedHistoSeries.Binding = "Count";
flexChart1.Series.Add(_rangedHistoSeries);
// specify the datasource for the chart
this.flexChart1.DataSource = GetAgeData();
// setting Axis titles
this.flexChart1.AxisX.Title = "Age Groups";
this.flexChart1.AxisY.Title = "Number Of Persons";
' Method for initializing FlexChart
Protected Sub SetupChart()
flexChart1.BeginUpdate()
#Region "SetupChart"
' clear data series collection
flexChart1.Series.Clear()
' setting ChartType to RangedHistogram
flexChart1.ChartType = ChartType.RangedHistogram
' create and add RangedHistogram type series
_rangedHistoSeries = New C1.Win.Chart.RangedHistogram()
_rangedHistoSeries.BindingX = "AgeGroup"
_rangedHistoSeries.Binding = "Count"
flexChart1.Series.Add(_rangedHistoSeries)
' specify the datasource for the chart
Me.flexChart1.DataSource = GetAgeData()
' setting Axis titles
Me.flexChart1.AxisX.Title = "Age Groups"
Me.flexChart1.AxisY.Title = "Number Of Persons"Note that the above sample codes use a custom method named GetAgeData to supply data to the chart. You can set up the data source as per your requirements.
// Method for creating data for FlexChart
Random rnd = new Random();
public List<Object> GetAgeData()
{
    var data = new List<Object>();
    for (int i = 0; i < 500; i++)
    {
        var age = rnd.NextDouble() < 0.6 ? rnd.Next(1, 45) : (rnd.NextDouble() < 0.7 ? rnd.Next(46, 65) : rnd.Next(66, 100));
        data.Add(new
        {
            AgeGroup = GetAgeGroups(age),
            Age = age,
            Count = 1,
        });
    }
    return data.OrderBy((dynamic x) => x.Age).ToList();
}
private static string GetAgeGroups(int age)
{
    if (age < 13)
        return "Children";
    else if (age >= 13 && age < 20)
        return "Youth";
    else if (age >= 20 && age < 25)
        return "Young Adults";
    else if (age >= 25 && age < 40)
        return "Adults";
    else if (age >= 40 && age < 65)
        return "Middle Aged";
    else
        return "Older";
}
' Method for creating data for FlexChart
Private rnd As New Random()
Public Function GetAgeData() As List(Of [Object])
Dim data As List(Of Object) = New List(Of [Object])()
For i As Integer = 0 To 499
Dim age As Integer = If(rnd.NextDouble() < 0.6, rnd.[Next](1, 45), (If(rnd.NextDouble() < 0.7, rnd.[Next](46, 65), rnd.[Next](66, 100))))
data.Add(New With {
.AgeGroup = GetAgeGroups(age),
age,
.Count = 1
})
Next
Return data.OrderBy(Function(x) x.age).ToList()
End Function
Private Shared Function GetAgeGroups(age As Integer) As String
If age < 13 Then
Return "Children"
ElseIf age >= 13 AndAlso age < 20 Then
Return "Youth"
ElseIf age >= 20 AndAlso age < 25 Then
Return "Young Adults"
ElseIf age >= 25 AndAlso age < 40 Then
Return "Adults"
ElseIf age >= 40 AndAlso age < 65 Then
Return "Middle Aged"
Else
Return "Older"
End If
End FunctionSee Also
How to visualize data distribution with histogram and ranged histogram charts