- ASP.NET MVC
- Getting Started
- Configuring your MVC Application
- Adding NuGet Packages to your App
- Adding Controls
- Client-Side Support
- Globalization
- Working with Controls
- Styling
- ASP.NET MVC Samples
- Release History
Gauge Types
ASP.NET MVC Edition controls comprise three kinds of gauges: Linear Gauge, Radial Gauge and Bullet Graph.
Type | Image | Usage |
|---|---|---|
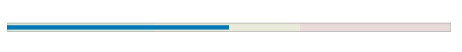
Linear Gauge: A linear gauge displays the value along a linear scale, using a linear pointer. |
| A linear gauge is commonly used to denote data as a scale value such as length, temperature, etc. |
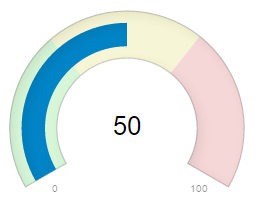
Radial Gauge: A radial gauge displays the value along a circular scale, using a curved pointer. The scale can be rotated as defined by the StartAngle and SweepAngle properties. |
| A radial gauge is commonly used to denote data such as volume, velocity, etc. |
Bullet Graph: A bullet graph displays a single value on a linear scale, along with a target value and ranges that instantly indicate whether the value is good or bad using the Good and Bad properties. |
| A bullet graph is a variant of a linear gauge, designed specifically for use in dashboards that display a number of single value data, such as yearly sales revenue. |