Generating Data Controls using AI
Overview
ActiveReports leverages AI to generate data visualization suggestions based on your data field names and types. The Report Wizard guides you through this process via a series of intuitive steps, outlined below.
Choosing Query and Fields
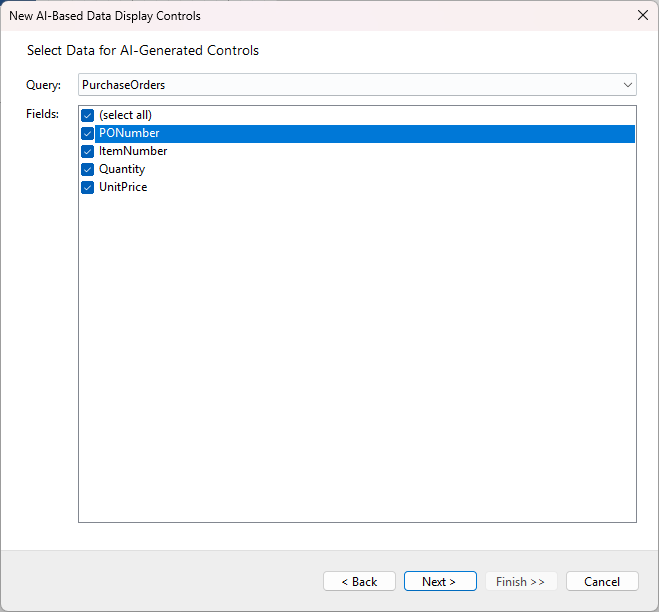
In the Query drop-down, select one of the report's available data queries. For detailed information on setting up queries, see the Configuring Data Queries in Report Wizard documentation page.
The Fields list displays all fields retrieved by the selected query. The AI engine analyzes the names and types of these fields to generate data visualization suggestions. You can check individual fields to visualize or use the (select all) option. Click Next > to proceed.
Generating Suggestions
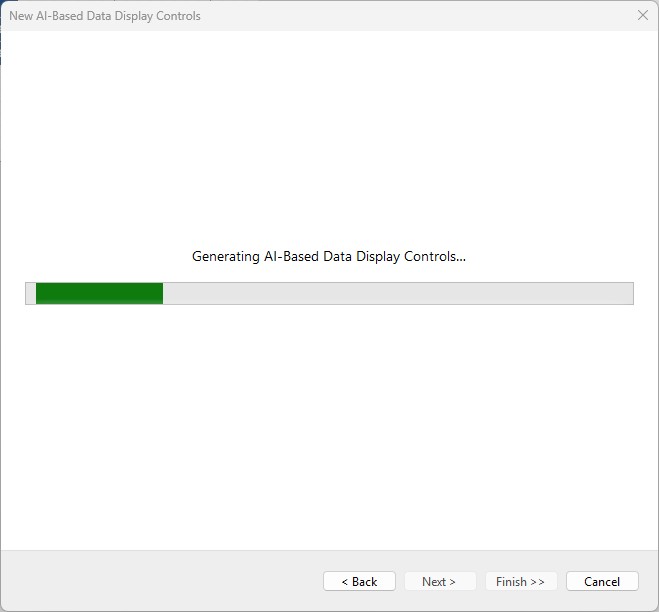
The next screen displays a waiting indicator while the AI processes your request. If an error occurs, the wizard will display a corresponding error message. You can interrupt the process or return to the previous step using the Cancel or Back buttons.
Selecting Data Display Controls
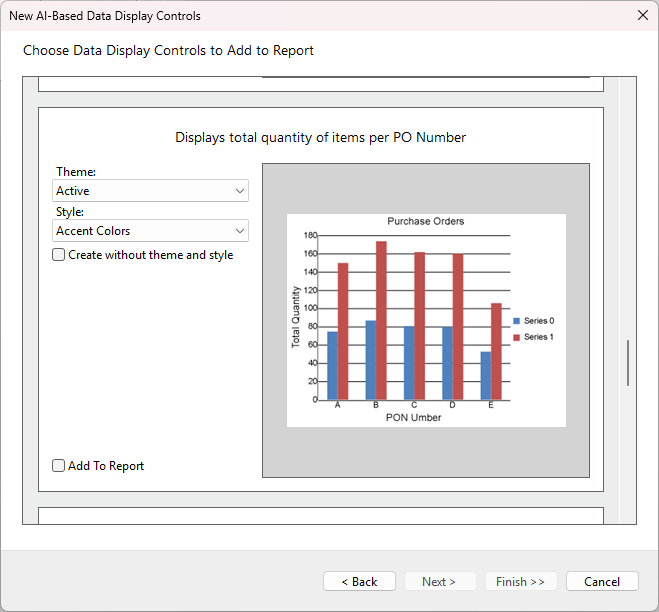
Once the AI retrieves the list of suggestions, they are displayed on the final screen.
For each data display control, you can customize the appearance using the Theme and Style dropdowns, or check Create without theme and style for a neutral look.
To include a visualization in your report, check the Add To Report box located at the bottom left of the control preview. You can select a single control or multiple controls simultaneously.
Once you have made your selections, click the Finish >> button to finalize the report creation.