What's New in ActiveReports.NET v20.1
AI-Driven Reporting
New AI Providers: Google Gemini and Local Ollama Servers
The AI Data Region Wizard is no longer limited to OpenAI. To better support diverse security and performance requirements, we’ve introduced:
Google Gemini Support: Direct integration with Gemini models for developers who prefer the Google Cloud ecosystem for their AI workflows.
Local AI via Ollama: You can now point ActiveReports to a local Ollama instance. This allows the Wizard to suggest data visualizations using models running on your own machine or private business server—no internet connection or external API keys required.
Once configured, the Report Wizard uses your selected AI provider to assist in creating data regions, offering both the power of cloud-based intelligence and the security of local execution.
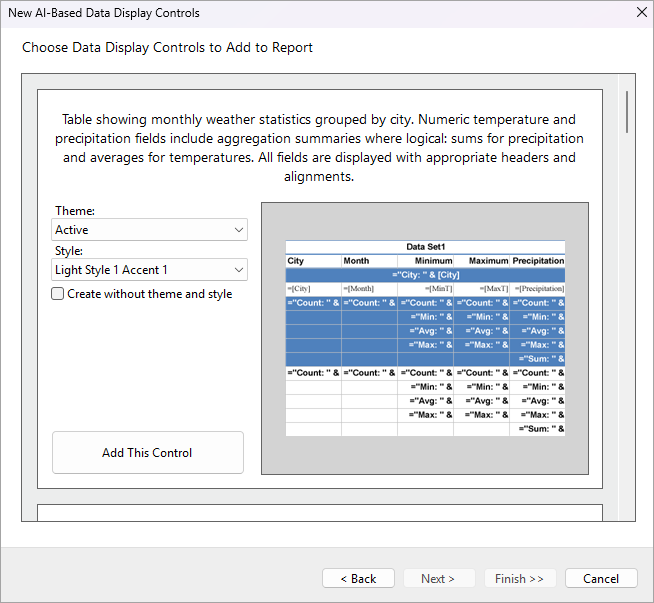
Enhanced AI-Driven Report Wizard
The AI-powered Report Wizard now produces cleaner, more consistent report layouts that match professional reporting standards—reducing the need for post-generation manual edits. The key updates:
Consistent Date Formatting – All date fields now default to the system Short Date (“d”) format in tables and charts.
Duplicate Column Removal – Automatically removes redundant columns for better readability.
Classic Grouped Table Layout – Uses the familiar Table Wizard structure with proper headers/footers, controlled page breaks, and collapsed groups.
Interactive & Design Enhancements
Apply Parameters and Target Bookmark Support
The Apply Parameters action now includes an optional TargetBookmark property that allows parameter updates and navigation to occur in a single interaction.
When a user clicks an interactive report element configured with ApplyParametersAction and TargetBookmark, the viewer applies the specified parameter changes, re-renders the report, and automatically navigates to the specified bookmark in the updated layout.
Conditional Page Breaks for Table Groups
Table Groups now support a Disabled setting for page breaks. You can set this property using an expression—for example, one that checks the value of a report parameter—to decide at runtime whether a page break should be inserted after the table group.
When Disabled is True, the page break is suppressed; when False, the page break is applied. This enhancement provides greater flexibility in controlling report pagination based on user input or other conditions.
Custom Close Handling in Web Designer
The Web Designer now supports an onBeforeClose callback to control whether the confirmation dialog appears when closing or switching reports with unsaved changes. For API details, refer to the WebDesigner API and Blazor WebDesigner API documentation.
Section Report Improvements
Improved Decimal Processing in Section Reports
Section Reports now preserve decimal numbers as decimal type from start to finish — in expressions, custom code, and aggregates such as SUM, AVG, MIN, and MAX. This eliminates automatic conversion to double and prevents rounding errors, delivering exact results for monetary and other high‑precision data.
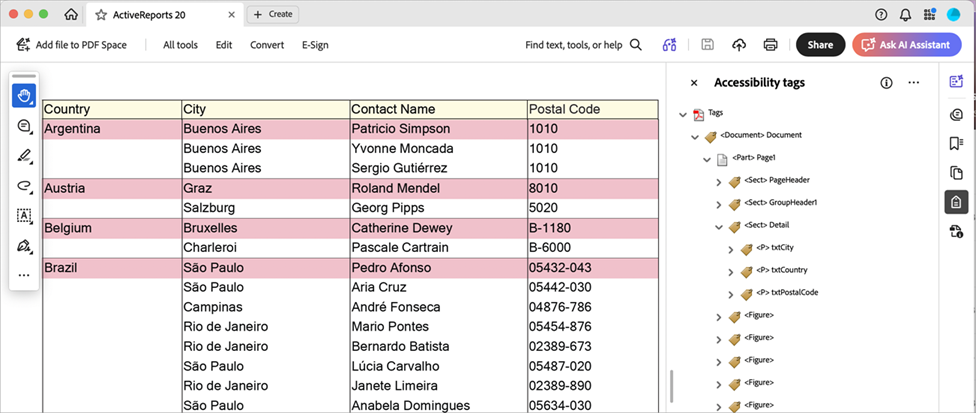
Improved PDF/UA Tagging for Section Reports
In ActiveReports 20.1, we’ve streamlined how Section Reports are exported to PDF/UA.
The exported files now follow your report's visual layout exactly, making them easier for screen readers to navigate. Even complex elements like subreports and cross-section controls are now automatically organized to ensure your documents remain fully accessible and compliant without any extra effort.
Viewer & Export Optimizations
Improved Font Fidelity in JS Viewer SVG Mode
The embedFonts setting in the JS Viewer improves the report output quality in SVG render mode by embedding report‑specified fonts directly into the output.
When set to true and renderMode is svg, fonts get displayed exactly as designed in the browser, providing consistent WYSIWYG results. This enhancement is especially useful for Section Reports, where SVG is used for higher precision.
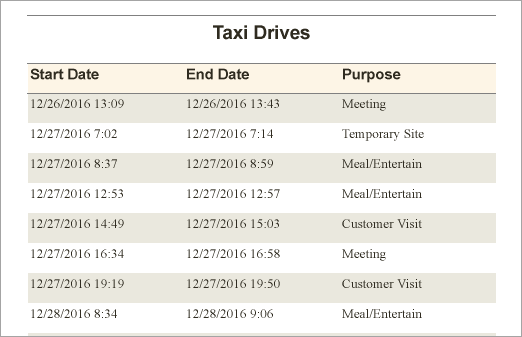
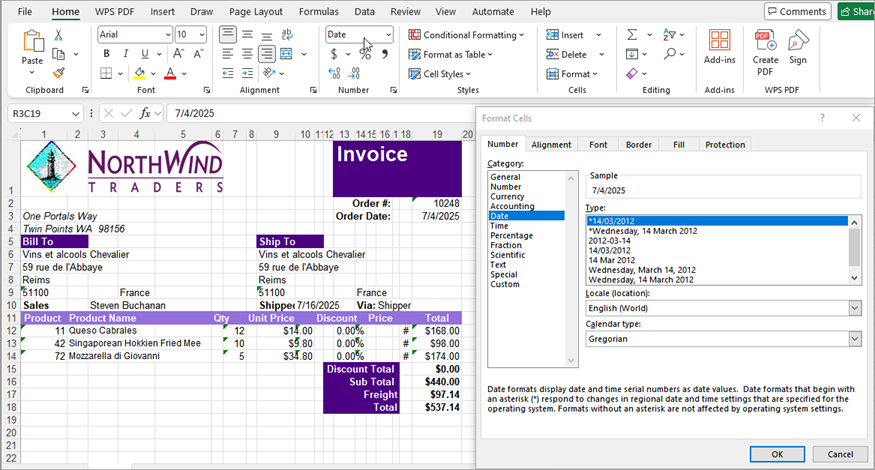
Improved Excel Export for Date/Time Values in Section Reports
Excel (XLS and XLSX) export for Section Reports now maps date and time values to Excel’s built‑in categories more accurately. If a TextBox uses a matching OutputFormat, exported cells appear as Date or Time instead of Custom.
Note: Some formats may still appear as Custom, depending on your regional settings.
Diagnostics & Debugging
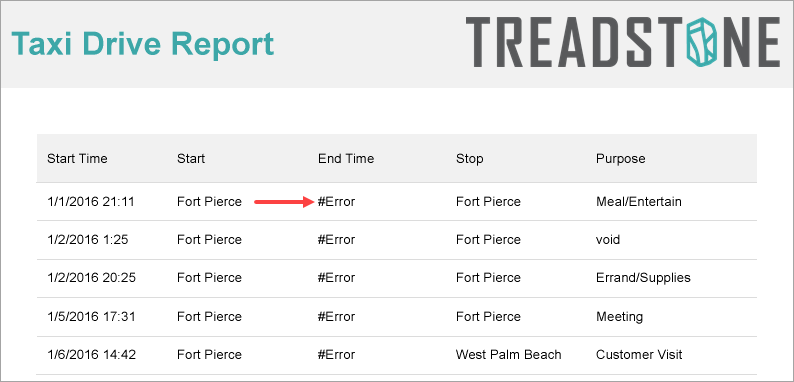
Expression Evaluation Error Display
ActiveReports introduces a new ShowEvaluationErrors setting in the ActiveReports configuration file.
When enabled, it replaces empty output with a localized #Error placeholder whenever a single‑value report item’s Value expression fails to evaluate. Supported items include TextBox, CheckBox, Barcode, Image, and Bullet, ensuring that expression issues are clearly visible during design, preview, and runtime.