
- Introduction
- Report Readers
- Report Authors
- DevOps
-
Developers
- Quick Start
- Breaking Changes
- ActiveReports Version Compatibility and Migration
- License ActiveReports
- Configure ActiveReports Using Code
- Work with Reports using Code
- Report Parts
- Create Designer and Viewer Applications
- Extensibility in ActiveReports
- External Customizations in ActiveReports
- Export Reports
- Print Reports
- Plugins Development
- Samples
- Troubleshooting
Designer Buttons
Designer buttons are located to the right of the designer tabs along the bottom of the designer, and are enabled when you are on the Designer tab. They allow you to control settings for the design surface.
Grid Settings
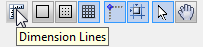
Dimension Lines
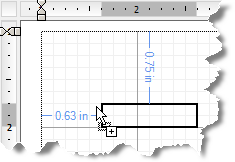
Dimension lines appear during a drag operation, and run from the borders of the report control or data region being moved or resized to the edges of the report designer surface. Dimension lines let you track the location of the control as you move it by displaying the distance between the control and the edge of the writable area of the report.
| Button Type | Behavior |
|---|---|
 |
 |
type=note
Note: With Section Reports, you can change the number of grid columns and rows in the Report Settings dialog on the Global Settings tab. With Page reports and RDLX reports, you can change the grid spacing in the Report Properties dialog on the General tab.
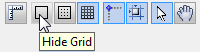
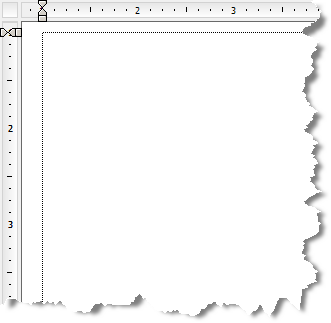
Hide Grid
By default, grid lines and dots appear on the report design surface. You can click this button to hide the grid and design your report on a blank page. Lines or dots are also removed from the design surface when you hide the grid, but Snap to Lines or Snap to Grid settings remain unaffected.
| Button Type | Behavior |
|---|---|
 |
 |
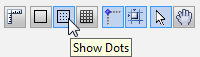
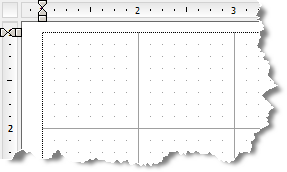
Show Dots
You can click this button to have dots appear on the design surface in between the grid lines to guide you in the placement of controls.
| Button Type | Behavior |
|---|---|
 |
 |
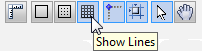
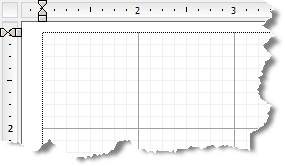
Show Lines
You can click this button to have faint grey lines appear on the design surface in between the grid lines to guide you in the placement of controls.
| Button Type | Behavior |
|---|---|
 |
 |
type=note
Note: Only one option out of Hide Grid, Show Dots and Show Lines can be selected at one time.
Control Drag and Drop Settings
These settings allow you to specify how you want controls to behave when you drag and drop them on the design surface.
type=info
Tip: If you plan to export a report to Excel format, use Snap Lines or Snap to Grid to ensure that your controls are aligned in columns and rows as it prevents overlapping. This makes the export to excel closer to how a report looks at run or design time.
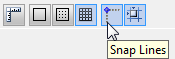
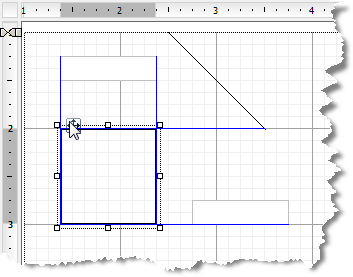
Snap Lines
This setting aligns the control you are dragging with other controls on the report design surface. When you drag the control around, snap lines appear when it is aligned with other controls or with the edges of the report, and when you drop it, it snaps into place in perfect alignment. See Snap Lines for more information.
| Button Type | Behavior |
|---|---|
 |
 |
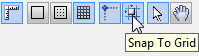
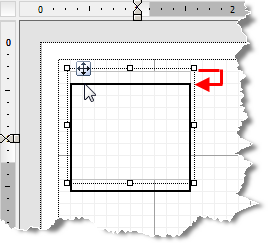
Snap to Grid
This setting aligns the control you are dragging with grid lines on the report design surface. When you drop the control, it snaps into place in alignment with the nearest grid mark. To place your controls freely on the report design surface, turn this setting off.
| Button Type | Behavior |
|---|---|
 |
 |
Mouse Modes
These settings allow you to specify how you want the mouse to behave in the designer.
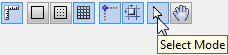
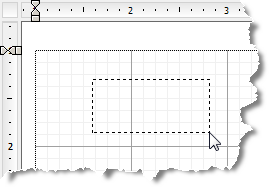
Select Mode
In Select mode, when you click items on the report designer surface, you select them. Use this mode for editing, data binding and styling in the Designer tab. An arrow cursor appears in the Select mode.
| Button Type | Behavior |
|---|---|
 |
 |
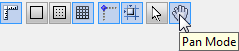
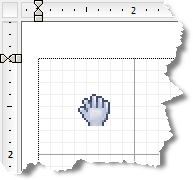
Pan Mode
Use the Pan mode to make navigation easier. In this mode, you cannot select, edit, add or delete a control from the design surface.In this mode, you cannot select, edit, or delete a control from the design surface. A hand cursor appears in Pan mode and you can navigate through your report by pressing the left mouse button and dragging the report to the desired position.
type=info
Tip: To enable Pan mode while you are in Select Mode, hold down the middle mouse button and move to the desired location with the hand cursor.
| Button Type | Behavior |
|---|---|
 |
 |