
- Formula Reference
- Contacting Us
- Getting Technical Support
- Formula Overview
-
Formula Functions
- Functions A to C
-
Functions D to G
- DATE
- DATEDIF
- DATEVALUE
- DAVERAGE
- DAY
- DAYS
- DAYS360
- DB
- DBCS
- DCOUNT
- DCOUNTA
- DDB
- DEC2BIN
- DEC2HEX
- DEC2OCT
- DECIMAL
- DEGREES
- DELTA
- DEVSQ
- DGET
- DISC
- DMAX
- DMIN
- DOLLAR
- DOLLARDE
- DOLLARFR
- DPRODUCT
- DROP
- DSTDEV
- DSTDEVP
- DSUM
- DURATION
- DVAR
- DVARP
- EDATE
- EFFECT
- ENCODEURL
- EOMONTH
- ERF
- ERF.PRECISE
- ERFC
- ERFC.PRECISE
- ERROR.TYPE
- ERRORTYPE
- EURO
- EUROCONVERT
- EVALUATE
- EVEN
- EXACT
- EXP
- EXPAND
- EXPON.DIST
- EXPONDIST
- F.DIST
- F.DIST.RT
- F.INV
- F.INV.RT
- F.TEST
- FACT
- FACTDOUBLE
- FALSE
- FDIST
- FIELDVALUE
- FILTER
- FILTERXML
- FIND
- FINDB
- FINV
- FISHER
- FISHERINV
- FIXED
- FLOOR
- FLOOR.MATH
- FLOOR.PRECISE
- FORECAST
- FORECAST.LINEAR
- FORECAST.ETS
- FORECAST.ETS.CONFINT
- FORECAST.ETS.SEASONALITY
- FORECAST.ETS.STAT
- FORMULATEXT
- FREQUENCY
- FTEST
- FV
- FVSCHEDULE
- GAMMA
- GAMMA.DIST
- GAMMA.INV
- GAMMADIST
- GAMMAINV
- GAMMALN
- GAMMALN.PRECISE
- GAUGEKPISPARKLINE
- GAUSS
- GCD
- GEOMEAN
- GESTEP
- GETPIVOTDATA
- GROWTH
- Functions H to L
- Functions M to Q
- Functions R to S
- Functions T to Z
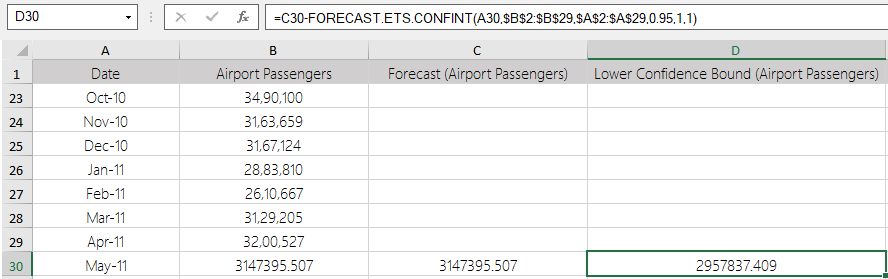
FORECAST.ETS.CONFINT
This function returns a confidence interval for the forecast value at the specified target date. Using confidence interval can help grasp the accuracy of the predicted model. A smaller interval would imply more confidence in the prediction for this specific point.
Syntax
=FORECAST.ETS.CONFINT(target_date,values,timeline,[confidence_level],[seasonality],[data_completion],[aggregation])
Arguments
The function has the following arguments:
| Argument | Description |
|---|---|
| target_date | [Required] is a date for which you want to predict a new value. Must be after the last date in the timeline. |
| values | [Required] is a range of the historical values for which you want to predict a new point. |
| timeline | [Required] is a range of date/time values that correspond to the historical values. The timeline range must be of the same size as the values range. Date/time values must have a constant step between them. |
| confidence_level | [Optional] is a numeric value between 0 and 1 (exclusive) that specifies the confidence level for the calculated confidence interval. If it is omitted, the default value of 0.95 is used. |
| seasonality | [Optional] is a numeric value that specifies which method should be used to detect the seasonality. The possible values are listed in the table below. * 1 or omitted: Seasonality is detected automatically. Positive, whole numbers are used for the length of the seasonal pattern. * 0: No seasonality, the prediction will be linear. * an integer greater than or equal to 2: The specified number is used for the length of the seasonal pattern. |
| data_completion | [Optional] is a numeric value that specifies how to process the missing data points in the timeline data range. The possible values are listed below. * 1 or omitted: Missing points are calculated as the average of the neighboring points. * 0: Missing points are treated as zero values. |
| aggregation | [Optional] is a numeric value that specifies which function should be used to aggregate identical time values in the timeline data range. The possible values are listed below. |
Aggregation values
| Value | Description |
|---|---|
| 1 or omitted | AVERAGE |
| 2 | COUNT |
| 3 | COUNTA |
| 4 | MAX |
| 5 | MEDIAN |
| 6 | MIN |
| 7 | SUM |
Remarks
A confidence interval of 95% means that 95% of future points are expected to fall within this radius from the result FORECAST.ETS forecasted (with normal distribution).
Data Types
Returns a specified statistical value relating to a time series.
Examples
Version Available
This function is available in product version 16.0 or later.