
-
Spread for ASP.NET Product Documentation
-
Developer's Guide
- Getting Started
- Understanding the Product
- Namespaces Overview
- Working with the Spread Designer
- Customizing User Interaction
- Customizing the Appearance
- Customizing with Cell Types
- Managing Data Binding
- Managing Data in the Component
- Managing Formulas
- Managing File Operations
- Using Sheet Models
- Maintaining State
- Working with the Chart Control
- Using Touch Support with the Component
- Assembly Reference
- Client-Side Scripting Reference
- Import and Export Reference
-
Developer's Guide
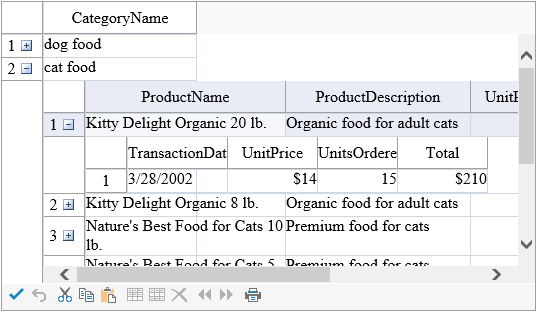
Displaying Data as a Hierarchy
You can display relational data, such as from a relational database, on a sheet in hierarchies. The following figure shows an example of how you can display the data from the database provided for the tutorials.
To set up hierarchical data display, you first create a data set to hold the relational data, then define the relations between the data, and finally, set the component to display the data as you want. This is the procedure described in the examples that follow.
Properties such as EditModePermanent and EditModeReplace only apply to the parent Spread and do not apply to the child sheets unless you set them in the ChildViewCreated event.
The hierarchical display of data, of displaying sheets within cells of a spread sheet, can fill up the visible part of the component quickly. In order to let you minimize the amount of hierarchical overhead, that is the amount of space taken by the higher levels of the hierarchy, you can collapse the hierarchy using the display of the hierarchy bar. For more information about the hierarchy bar, refer to Customizing the Hierarchy Bar.
For more information on Outlook-style grouping for a hierarchical display of data, refer to Customizing Grouping of Rows of User Data.
For more information on row expansion, refer to Handling Row Expansion.
!type=note
Note: The SpreadImage class is not supported in the ChildViewCreated event.
Using a Shortcut
Create your data set.
Set up the data relations between the data coming from the data set, for example, between tables coming from a relational database.
Set the FpSpread DataSource or the sheet DataSource property equal to the data set.
Provide code in the FpSpread component’s ChildViewCreated event for displaying the parent and child views of the data.
Example
This example binds the component to a data set that contains multiple related tables from a database and sets up the component to display the data in hierarchies. This example uses the database provided for the tutorials (databind.mdb). If you performed the default installation, the database file is in \Program Files\Mescius\Spread.NET 15\docs\Windows Forms\TutorialFiles. This assumes that before this code you have an include statement:
Imports System.Data.OleDbAnd here is the code:
Protected Sub Page_Load(sender As Object, e As EventArgs) Handles Me.Load
      If IsPostBack Then Return
      End If
      ' Call subroutines to set up data and format the Spread component
      InitData()
      FormatSpread()
End Sub
Private Sub InitData()
        Dim con As New OleDbConnection()
        Dim cmd As New OleDbCommand()
        Dim da As New OleDbDataAdapter()
        Dim ds As New System.Data.DataSet()
        Dim dt As System.Data.DataTable
con.ConnectionString = "Provider=Microsoft.Jet.OLEDB.4.0; Data Source=C:\\Program Files\Mescius\Spread.NET 15\Windows Forms\TutorialFiles\databind.mdb"
con.Open()
With cmd
.Connection = con
.CommandType = System.Data.CommandType.TableDirect
.CommandText = "Categories"
End With
da.SelectCommand = cmd
da.Fill(ds, "Categories")
cmd.CommandText = "Products"
da.SelectCommand = cmd
da.Fill(ds, "Products")
cmd.CommandText = "Inventory Transactions"
da.SelectCommand = cmd
da.Fill(ds, "Inventory Transactions")
ds.Relations.Add("Root", ds.Tables("Categories").Columns("CategoryID"), ds.Tables("Products").Columns("CategoryID"))

ds.Relations.Add("Secondary", ds.Tables("Products").Columns("ProductID"), ds.Tables("Inventory Transactions").Columns("TransactionID"))
FpSpread1.DataSource = ds
End Sub

Private Sub FormatSpread()
With FpSpread1.Sheets(0)
.ColumnHeader.Rows(0).Height = 30
.Columns(0).Visible = False
.Columns(0).Width = 200
End With
End Sub

Protected Sub FpSpread1_ChildViewCreated(sender As Object, e As FarPoint.Web.Spread.CreateChildViewEventArgs) Handles FpSpread1.ChildViewCreated
Dim dateType As New FarPoint.Web.Spread.DateTimeCellType()

If e.SheetView.RelationName = "Root" Then
With e.SheetView
.DataAutoCellTypes = False
.ColumnHeader.Rows(0).Height = 30
.Columns(0).Visible = False
.Columns(3).Visible = False
.Columns(4).Visible = False
.Columns(1).Width = 200
.Columns(2).Width = 185
.Columns(6).Width = 85
.Columns(7).Width = 80
.Columns(8).Width = 80
.Columns(5).CellType = New FarPoint.Web.Spread.CurrencyCellType()
.Columns(7).CellType = New FarPoint.Web.Spread.CheckBoxCellType()
End With
Else
With e.SheetView
.DataAutoCellTypes = False
.ColumnHeader.Rows(0).Height = 30
.Columns(0).Visible = False
.Columns(2).Visible = False
.Columns(3).Visible = False
.Columns(4).Visible = False
.Columns(7).Visible = False
.Columns(8).Visible = False
.Columns(9).Visible = False
.Columns(1).Width = 100
.Columns(6).Width = 80
.Columns(5).CellType = New FarPoint.Web.Spread.CurrencyCellType()
.Columns(1).CellType = dateType
'Add a total column
.ColumnCount = .ColumnCount + 1
.ColumnHeader.Cells(0, .ColumnCount - 1).Value = "Total"
.Columns(.ColumnCount - 1).CellType = New FarPoint.Web.Spread.CurrencyCellType()
.Columns(.ColumnCount - 1).Formula = "F1*G1"
End With
End If
End Sub