
- Document Solutions for Excel .NET Overview
- Key Features
- Getting Started
-
Features
- Worksheet
- Workbook
- Comments
- Hyperlinks
- Sort
- Filter
- Group
- Conditional Formatting
- Data Validations
- Data Binding
- Import Data
- Digital Signatures
- Formulas
- Custom Functions
- Shapes
- Document Properties
- Styles
- Form Controls
- Barcodes
- Themes and Colors
- Chart
- Table
- Pivot Table
- Pivot Chart
- Sparkline
- Slicer
- Logging
- Defined Names
- AI Assistant
- Templates
- Formula Reference
- File Operations
- Document Solutions Data Viewer
- Tutorials
- API Reference
- Release Notes
Worksheet Views
This article demonstrates how to configure and manage worksheet views in Excel with DsExcel.NET, including pre-defined Views, customizing sheet view options, adjusting the zoom level, freezing panes, and splitting panes. These features allow you to manage the visible area and layout of your worksheet to enhance data readability.
Pre-defined Views
DsExcel, similar to MS Excel, provides pre-defined views to make it easier for users to preview the page layout and page breaks before printing the document.
Normal View - The default worksheet view.
Page Layout View - Displays the worksheet as it will appear when printed, including page boundaries, headers, and footers.
Page Break View - Displays the locations of page breaks for printing.
You can use the ViewType property of the IWorksheetView interface to set a preset worksheet view.
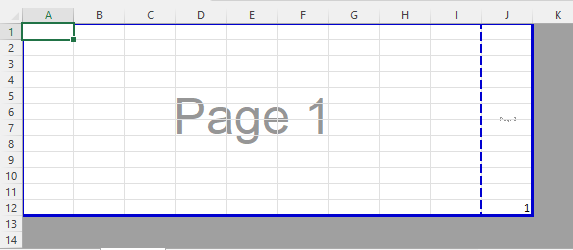
Refer to the following sample code to set the view to Page Break Preview.
// Create a new workbook.
IWorkbook workbook = new Workbook();
IWorksheet worksheet = workbook.ActiveSheet;

worksheet.Range["J12"].Value = 1;

// Set the view mode of the worksheet to PageBreakPreview.
worksheet.SheetView.ViewType = ViewType.PageBreakPreview;

// Modify the zoom of the PageBreakPreview to 80%.
worksheet.SheetView.Zoom = 80;

// Save to an excel file.
workbook.Save("PageBreak.xlsx");
The output is shown in the figure below:
Sheet View Options
Users can customize how a worksheet is displayed, including options such as gridline visibility, row and column headers, formula display, orientation, gridline color, and blank area visibility.
You can configure the worksheet view by setting the SheetView property of the IWorksheet interface or by using properties of the IWorksheetView interface. The table below lists some properties of the IWorksheetView interface.
Property | Description |
|---|---|
Use this property to get and set the gridline color. | |
Use this property to get and set the number of the leftmost column in the worksheet. | |
Use this property to get and set the number of the row that appears at the top of the worksheet. | |
Use this property to get and set whether the specified worksheet is displayed from right to left instead of from left to right. | |
Use this property to get and set whether the worksheet displays formulas. | |
Use this property to get and set whether the gridlines are displayed. | |
Use this property to get and set whether the vertical gridlines are displayed. | |
Use this property to get and set whether the horizontal gridlines are displayed. | |
Use this property to get and set whether the headers are displayed. | |
Use this property to get and set whether the outline symbols are displayed. | |
Use this property to get and set whether a ruler is displayed for the specified worksheet. | |
Use this property to get and set whether the whitespace is displayed. | |
Use this property to get and set whether the zero values are displayed. |
type=info
If the value of DisplayGridlines is set, DisplayVerticalGridlines and DisplayHorizontalGridlines will be set to the same value automatically.
Vertical and horizontal gridlines are only visible while interacting with SpreadJS and are not visible in Excel or PDF.
Refer to the following sample code to set the table to display only vertical gridlines.
// Create a new workbook.
var workbook = new Workbook();
IWorksheet worksheet = workbook.Worksheets[0];

worksheet.Range["A10"].Value = 10;

// Set to not show horizontal gridlines.
 worksheet.SheetView.DisplayHorizontalGridlines = false;

// Set to show vertical gridlines.
worksheet.SheetView.DisplayVerticalGridlines = true;

// Save as an SJS file.
workbook.Save("gridlines.sjs");
Zoom
Zoom is used to adjust the display size of worksheet content on the screen. Users can set the zoom level to enlarge or reduce the view for easier detail inspection or overview of large amounts of data.
Zoom Level
You can retrieve or specify the display scale of the worksheet (in percentage) by setting the Zoom property of the IWorksheetView interface. For example, a value of 100 represents the default size, while 200 zooms in to double the display size, and so on.
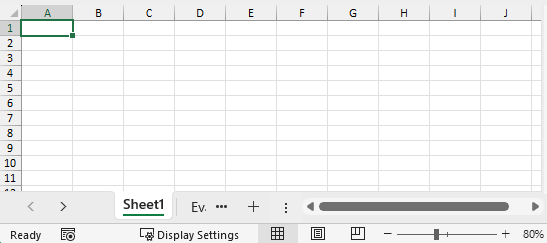
Refer to the following sample code to set the zoom level to 80%.
// Create a new workbook.
var workbook = new GrapeCity.Documents.Excel.Workbook();
IWorksheet worksheet = workbook.Worksheets[0];

// Set the zoom level to 80%.
worksheet.SheetView.Zoom = 80;

// Save to an excel file.
workbook.Save("zoom.xlsx");
The output is shown in the figure below:
Fit to Selection
You can use the FitSelection property of the IWorksheetView interface to automatically adjust the zoom level so that the selected area is fully visible in the current window, maximizing the display of the selected content.
type=info
The FitSelection property is only supported on chart sheets. If you use this property on a regular worksheet, a
NotSupportedExceptionwill be thrown.SpreadJS does not support chart sheets. If a file has the FitSelection property set and is exported to SJS or SSJSON format, the FitSelection setting will not be retained.
Refer to the following sample code to set the zoom level to fit the selected range.
// Create a new workbook.
var workbook = new GrapeCity.Documents.Excel.Workbook();
IWorksheet worksheet = workbook.Worksheets[0];

// Prepare data.
worksheet.Name = "Data";
worksheet.Range["A1:C13"].Value = new object[,]
{
    {null, "Blue Series", "Orange Series"},
    {"Jan", 0, 59.1883603948205},
    {"Feb", 44.6420211591501, 52.2280901938606},
    {"Mar", 45.2174930051225, 49.8093056416248},
    {"Apr", 62, 37.3065749226828},
    {"May", 53, 34.4312192530766},
    {"Jun", 31.8933622049831, 69.7834561753736},
    {"Jul", 41.7930895085093, 63.9418103906982},
    {"Aug", 73, 57.4049534494926},
    {"Sep", 49.8773891668518, 33},
    {"Oct", 50, 74},
    {"Nov", 54.7658428630216, 22.9587876597096},
    {"Dec", 32, 54},
};

// Create a chart sheet and add an area chart.
IWorksheet chartSheet = workbook.Worksheets.Add(SheetType.Chart);
chartSheet.Activate();
chartSheet.Name = "Chart";
Drawing.IShape shape = chartSheet.Shapes.AddChart(Drawing.ChartType.Area, 0, 0, 360, 230);
shape.Chart.SeriesCollection.Add(worksheet.Range["A1:C13"], RowCol.Columns);
shape.Chart.ChartTitle.Text = "Area Chart";

// Set the chart sheet to fit selection.
chartSheet.SheetView.FitSelection = true;

// Save to an excel file.
workbook.Save("FitSelection.xlsx");
The output is shown in the figure below:
Panes
The pane functionality enables you to divide a worksheet into multiple independent viewing areas. By using Freeze Panes or Split Panes, you can view different parts of a worksheet at the same time without excessive scrolling, significantly enhancing the convenience and efficiency of data review.
You can freeze, unfreeze, split, or unsplit panes by using the properties and methods of the IWorksheet interface. The table below lists some properties of the IWorksheet interface.
Property | Description |
|---|---|
Use this property to get the starting row position of the current frozen pane. | |
Use this property to get the starting column position of the current frozen pane. | |
Use this property to get the specified row at the bottom of the worksheet to freeze so that they remain visible while scrolling. | |
Use this property to get the specified column at the right of the worksheet to freeze so that they remain visible while scrolling. | |
Use this property to get the row index where the worksheet is split into multiple panes. | |
Use this property to get the column index where the worksheet is split into multiple panes. | |
Use this property to get or set the custom color of the frozen pane lines. |
Method | Description |
|---|---|
Use this method to freeze panes in the worksheet by specifying the row and column indexes to set the frozen rows and columns. | |
Use this method to freeze panes at the bottom and right of the worksheet by specifying the row and column indexes. | |
Use this method to unfreeze all frozen panes in the current worksheet. | |
Use this method to unfreeze all frozen panes at the bottom and right of the current worksheet. | |
Use this method to lock rows and columns in a worksheet, dividing it into multiple areas that can be scrolled independently. Specify the split location by providing the cell index as parameters. | |
Use this method to unsplit the split panes. Using this method is similar to using IWorksheet.SplitPanes(0,0). |
Freeze Panes
DsExcel supports freezing panes in a worksheet, allowing users to keep specific rows or columns visible while scrolling through the rest of the content.
You can also set a custom color for the frozen pane lines. The custom color is only visible while interacting with SpreadJS and is not visible in exported Excel or PDF files.
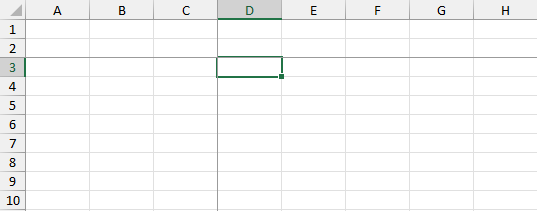
Refer to the sample code below to freeze panes in the worksheet.
// Create a new workbook.
var workbook = new GrapeCity.Documents.Excel.Workbook();
IWorksheet worksheet = workbook.Worksheets[0];

// Freeze Panes.
worksheet.FreezePanes(2, 3);

// Save to an excel file.
workbook.Save("FreezePanes.xlsx");
The output is shown in the figure below:
Refer to the sample code below to set the frozen pane line color to blue in the worksheet.
// Create a new workbook.
var workbook = new GrapeCity.Documents.Excel.Workbook();
IWorksheet worksheet = workbook.Worksheets[0];

// Freeze panes.
worksheet.FreezePanes(5, 5);

// Set frozen line color as blue.
worksheet.FrozenLineColor = Color.Blue;

// Save as an SJS file.
workbook.Save("frozenlinecolor.sjs");
Refer to the sample code below to unfreeze the frozen panes in the worksheet.
// UnFreeze Panes.
worksheet.UnfreezePanes();
Freeze Trailing Panes
DsExcel supports freezing trailing panes, allowing the bottom rows and rightmost columns of a worksheet to remain visible while scrolling, making it easier to review and compare data.
Frozen trailing panes are only visible when interacting with SpreadJS format and are not available in exported Excel or PDF files.
Refer to the sample code below to freeze trailing panes in a worksheet.
// Create a new workbook.
var workbook = new Workbook();
IWorksheet worksheet = workbook.Worksheets[0];

// Freeze trailing pane.
worksheet.FreezeTrailingPanes(2, 3);

// Get the number of frozen trailing rows and columns.
Console.WriteLine("Number of trailing rows and columns" + worksheet.FreezeTrailingRow + worksheet.FreezeTrailingColumn);

// Save as an SJS file.
workbook.Save("freezetrailingrowscolumns.sjs");
Refer to the sample code below to unfreeze trailing panes in a worksheet.
// Create a new workbook.
var workbook = new Workbook();
IWorksheet worksheet = workbook.Worksheets[0];

// Freeze trailing pane.
worksheet.FreezeTrailingPanes(2, 3);

// Unfreeze trailing pane.
worksheet.UnfreezeTrailingPanes();

// Save as an SJS file.
workbook.Save("unfreezetrailingrowscolumns.sjs");
Split Panes
DsExcel allows users to split the worksheet window into multiple independent viewing areas. By dividing the panes, you can view and edit data in different sections of the same worksheet at the same time, reducing the need for frequent scrolling. Each split pane can be scrolled independently, making it easier to browse and compare large amounts of data.
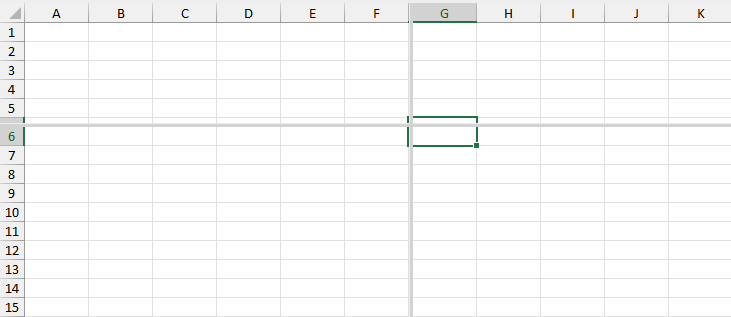
Refer to the sample code below to split a worksheet into multiple panes.
// Create a new workbook.
Workbook workbook = new Workbook();
IWorksheet worksheet = workbook.Worksheets[0];

// Split worksheet into independent panes.
worksheet.SplitPanes(5, 6);
var splitRow = worksheet.SplitRow;
var splitColumn = worksheet.SplitColumn;

// Save to an excel file.
workbook.Save("SplitPanes.xlsx");
The output is shown in the figure below:
Refer to the sample code below to remove split panes.
// Unsplit Panes.
worksheet.UnsplitPanes();