Formatting
In DataViewsJS, you can customize the way in which text, date, time, numbers, and other values are displayed.
You can use any of the following options to format the data.
- Excel like Formatting string
- Custom Formatting function
These steps assume that you have already initialized the grid and defined the columns. See Creating a Basic Grid and Defining Columns for additional information.
Excel-like Formatting string
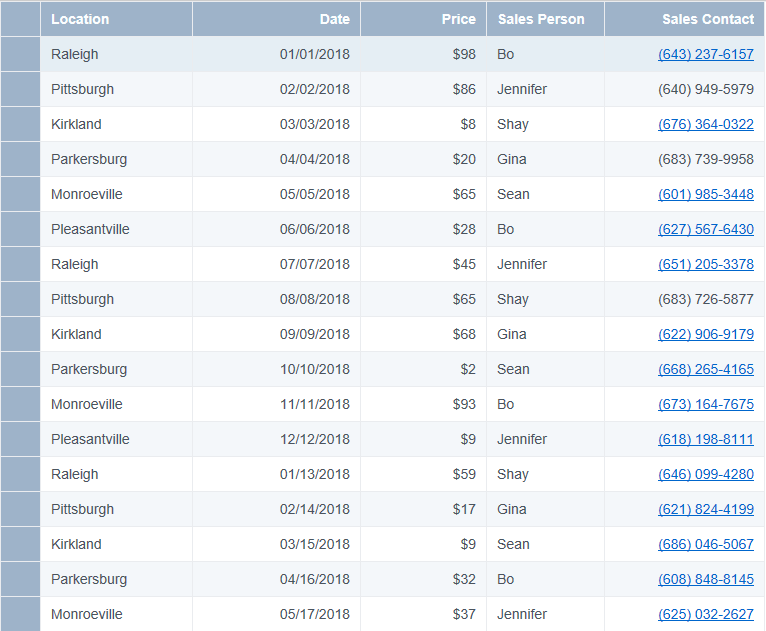
DataViewsJS provides a built-in format library which allows you to format the data in a column using format strings, similar to those used in Microsoft Excel. You can design a grid where columns display the date, currency, or contacts in a specific format as shown in the following image.

Sample Code
Add the format property and string formatter to the column definition.
For example:
- Date: mm/dd/yyyy renders a date format.
- Price: \$#,## renders the number in currency format with a comma separator.
- Sales Contact: (###) ###-#### renders a phone number format.
Note: The Date format in columns can be defined in the following three ways: - By javascript date object. - By date string. String must be recognised by Date.parse() method. - By an integer value. This integer value contains the OADate value which does not include milliseconds value. This format is used to make DataViewsJS compatible with Spread.Sheets.
var locations = ['Raleigh', 'Pittsburgh', 'Kirkland', 'Parkersburg', 'Monroeville', 'Pleasantville'];
var salespeople = ['Bo', 'Jennifer', 'Shay', 'Gina', 'Sean'];
var data = [];
for (var i = 0; i < 100; i++) {
  data.push({
    id: i,
    locations: locations[i % locations.length],
    date: new Date(2015, i % 12, i % 28),
    price: Math.floor(Math.random() * 100),
    salesPerson: salespeople[i % salespeople.length],
    phone: Math.floor(6000000000 + Math.random() * 900000000),
  });
}
var columns = [
  {
    id: 'locations',
    caption: 'Location',
    dataField: 'locations',
    width: '*',
  },
  {
    id: 'date',
    caption: 'Date',
    dataField: 'date',
    format: 'mm/dd/yyyy',
    width: '*',
  },
  {
    id: 'price',
    caption: 'Price',
    dataField: 'price',
    format: '$#,##',
    width: '*',
  },
  {
    id: 'salesPerson',
    caption: 'Sales Person',
    dataField: 'salesPerson',
    width: '*',
  },
  {
    id: 'phone',
    caption: 'Sales Contact',
    dataField: 'phone',
    format: '(###) ###-####',
    width: '*',
  },
];
- Initialize the code by calling the grid ID from the DIV tag.
Custom Formatting function
You can also create your own formatter for an individual cell by specifying a format function to column.

Sample Code
Define an function that implements the format function and returns the desired formatted string. Common examples include formatting dates, setting decimal places, and configuring number types. You can even transform data from one character set to another.
To implement a custom formatter, reference any formatter library you like, define a function that implements the format functionality and return the formatted result.
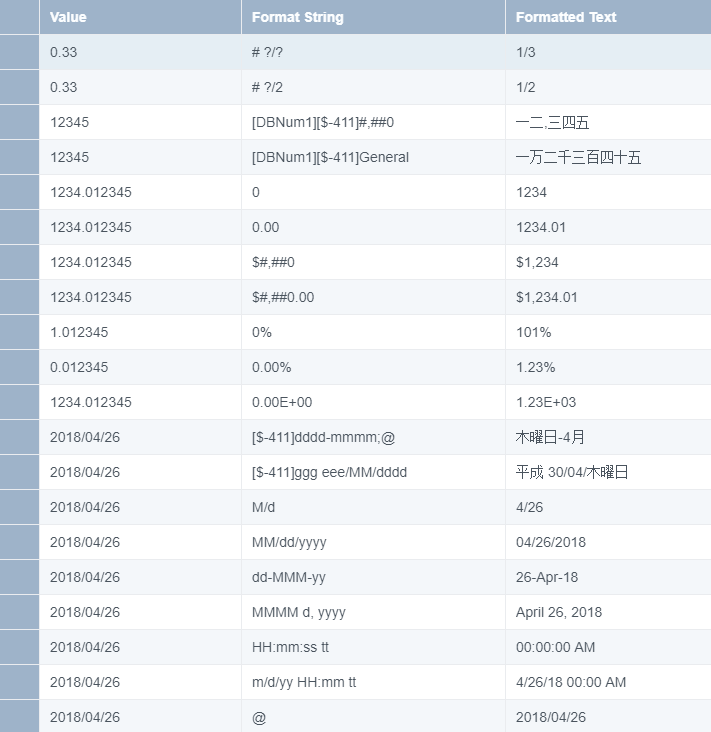
The following example is still using the built-in format library, it's used to show the power of that library, of cause, you can use any format library here, the format callback funciton takes a params object with the following values:
- colId The id of the column which will need to be formatted
- value The underline value of that column
- data The data item of that row.
var date = '2016/04/26';
var data = [
  {
    value: 0.33,
    pattern: '# ?/?',
  },
  {
    value: 0.33,
    pattern: '# ?/2',
  },
  {
    value: 12345,
    pattern: '[DBNum1][$-411]#,##0',
  },
  {
    value: 12345,
    pattern: '[DBNum1][$-411]General',
  },
  {
    value: 1234.012345,
    pattern: '0',
  },
  {
    value: 1234.012345,
    pattern: '0.00',
  },
  {
    value: 1234.012345,
    pattern: '$#,##0',
  },
  {
    value: 1234.012345,
    pattern: '$#,##0.00',
  },
  {
    value: 1.012345,
    pattern: '0%',
  },
  {
    value: 0.012345,
    pattern: '0.00%',
  },
  {
    value: 1234.012345,
    pattern: '0.00E+00',
  },
  {
    value: date,
    pattern: '[$-411]dddd-mmmm;@',
  },
  {
    value: date,
    pattern: '[$-411]ggg eee/MM/dddd',
  },
  {
    value: date,
    pattern: 'M/d',
  },
  {
    value: date,
    pattern: 'MM/dd/yyyy',
  },
  {
    value: date,
    pattern: 'dd-MMM-yy',
  },
  {
    value: date,
    pattern: 'MMMM d, yyyy',
  },
  {
    value: date,
    pattern: 'HH:mm:ss tt',
  },
  {
    value: date,
    pattern: 'm/d/yy HH:mm tt',
  },
  {
    value: date,
    pattern: '@',
  },
];

function formatValues(args) {
  var rowData = args.data;
  var value = rowData.value;
  var formatString = rowData.pattern;
  var excelFormatter = new GC.DataViews.GeneralFormatter(formatString);
  return excelFormatter.format(value);
}
var columns = [
  {
    id: 'value',
    caption: 'Value',
    dataField: 'value',
    width: '*',
    cssClass: 'textLeft',
  },
  {
    id: 'pattern',
    caption: 'Format String',
    dataField: 'pattern',
    width: '*',
  },
  {
    id: 'text',
    caption: 'Formatted Text',
    dataField: 'text',
    format: formatValues,
    width: '*',
    cssClass: 'textLeft',
  },
];
- Initialize the code by calling the grid ID from the DIV tag.
Feedback
Submit and view feedback for


