


AI Assistant
To use AI assistance in the WebDesigner, you should enable this feature in your WebDesigner application by configuring the application to use the AI reporting endpoint.
See Web AI Assistant Setup for details on how to enable this feature in the WebDesigner. The Explore option appears only when the configuration is complete.
AI assistance in the Web Designer helps generate visualization suggestions for selected dataset fields or an entire dataset in a report. To receive AI-generated recommendations, you can use the Explore option in the Data Sets section of the Data panel in two ways:
select a subset of fields and click Explore
click Explore for the whole dataset
Depending on the selected fields, the generated results can include report elements such as Table, Tablix, and Chart. These suggestions are intended to provide a useful starting point for report design. After you insert a suggestion, it becomes standard report content that you can modify in the Web Designer like any other report element.
To generate visualization suggestions in the Web Designer:
See Web AI Assistant Setup for details on how to enable this feature in the WebDesigner. Ensure that you have enabled AI assistance in the Web Designer, configured the application to use the AI reporting endpoint, and that the report contains a dataset.
Go to Data tab and then to Data Sets.
Select the dataset fields that you want to visualize.
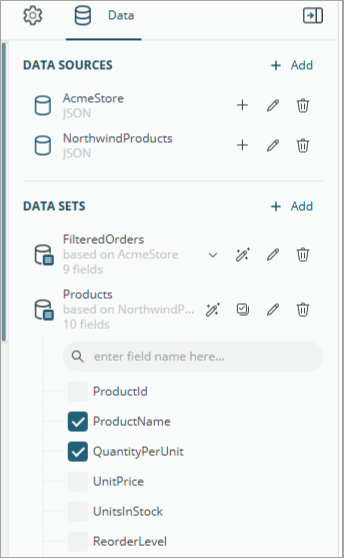
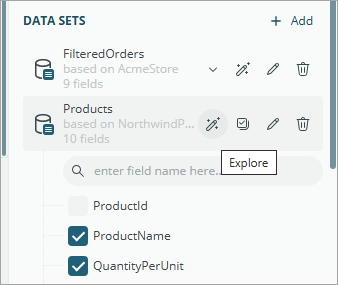
Click Explore to generate visualization suggestions.
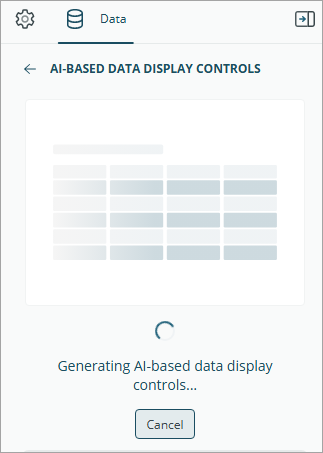
Wait while the Web Designer processes the request and displays a loading state.
Review the suggested visualizations. Each suggestion may include a a proposed layout, such as a table, tablix, or chart, and a short description.
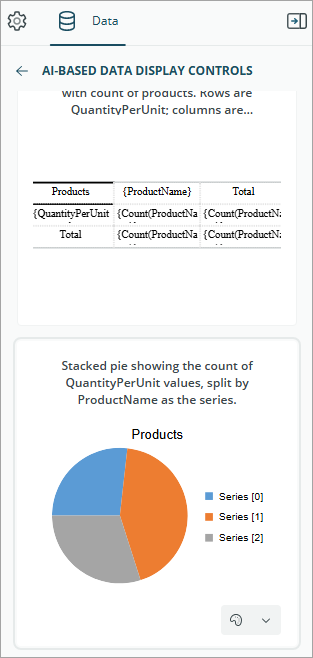
On Data tab, double-click the suggestion that best fits your report to insert it into the report.
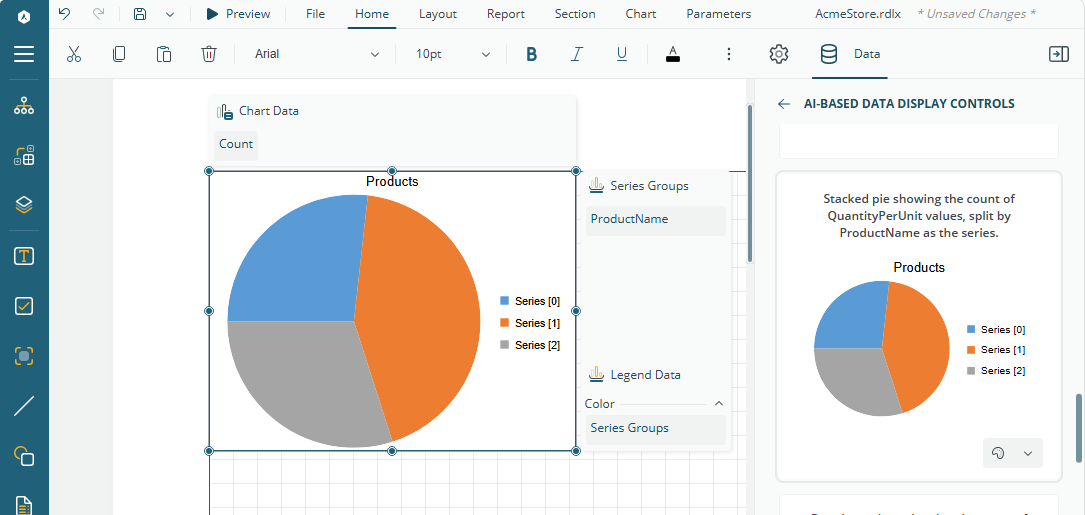
After insertion, you can adjust the layout and size, change formatting, update bound fields, or refine the result manually.