Get Started With Drill Through Reports
Introduction
A drill-through reporting allows a reader to navigate back and forth through a sequence of reports by clicking parametrized links. Such navigation usually consists of the main report that displays items summary and a subreport that provides details for a specific item. In ActiveReportsJS, a report author creates a drill-through link by configuring the Jump to Report action of a report item or its part.
In this tutorial, we build the Drillthrough Sales Chart from the ground up, providing experience with the typical report designing process. By the end, you will be able to do the following:
Create a new report
Bind the report to the OData API with multiple endpoints
Use the OData $select and $filter query options to reduce the volume of retrieved data
Build line chart and stacked column chart
Use the Report explorer to navigate through the report hierarchy
Use the Lookup function to display the data from multiple data sets
Setup the parametrized drill through navigation between the main report and the subreport
Use the
Galley modeandHistoryfunctions of the report viewer
Upon completion of all tutorial steps, the final report will look like this: live demo.
Prerequisites
The following content assumes that you have the Standalone Report Designer running. Visit the tutorial for detailed information. A stable internet connection is also required to access the Demo Data Hub.
Creating a New Report
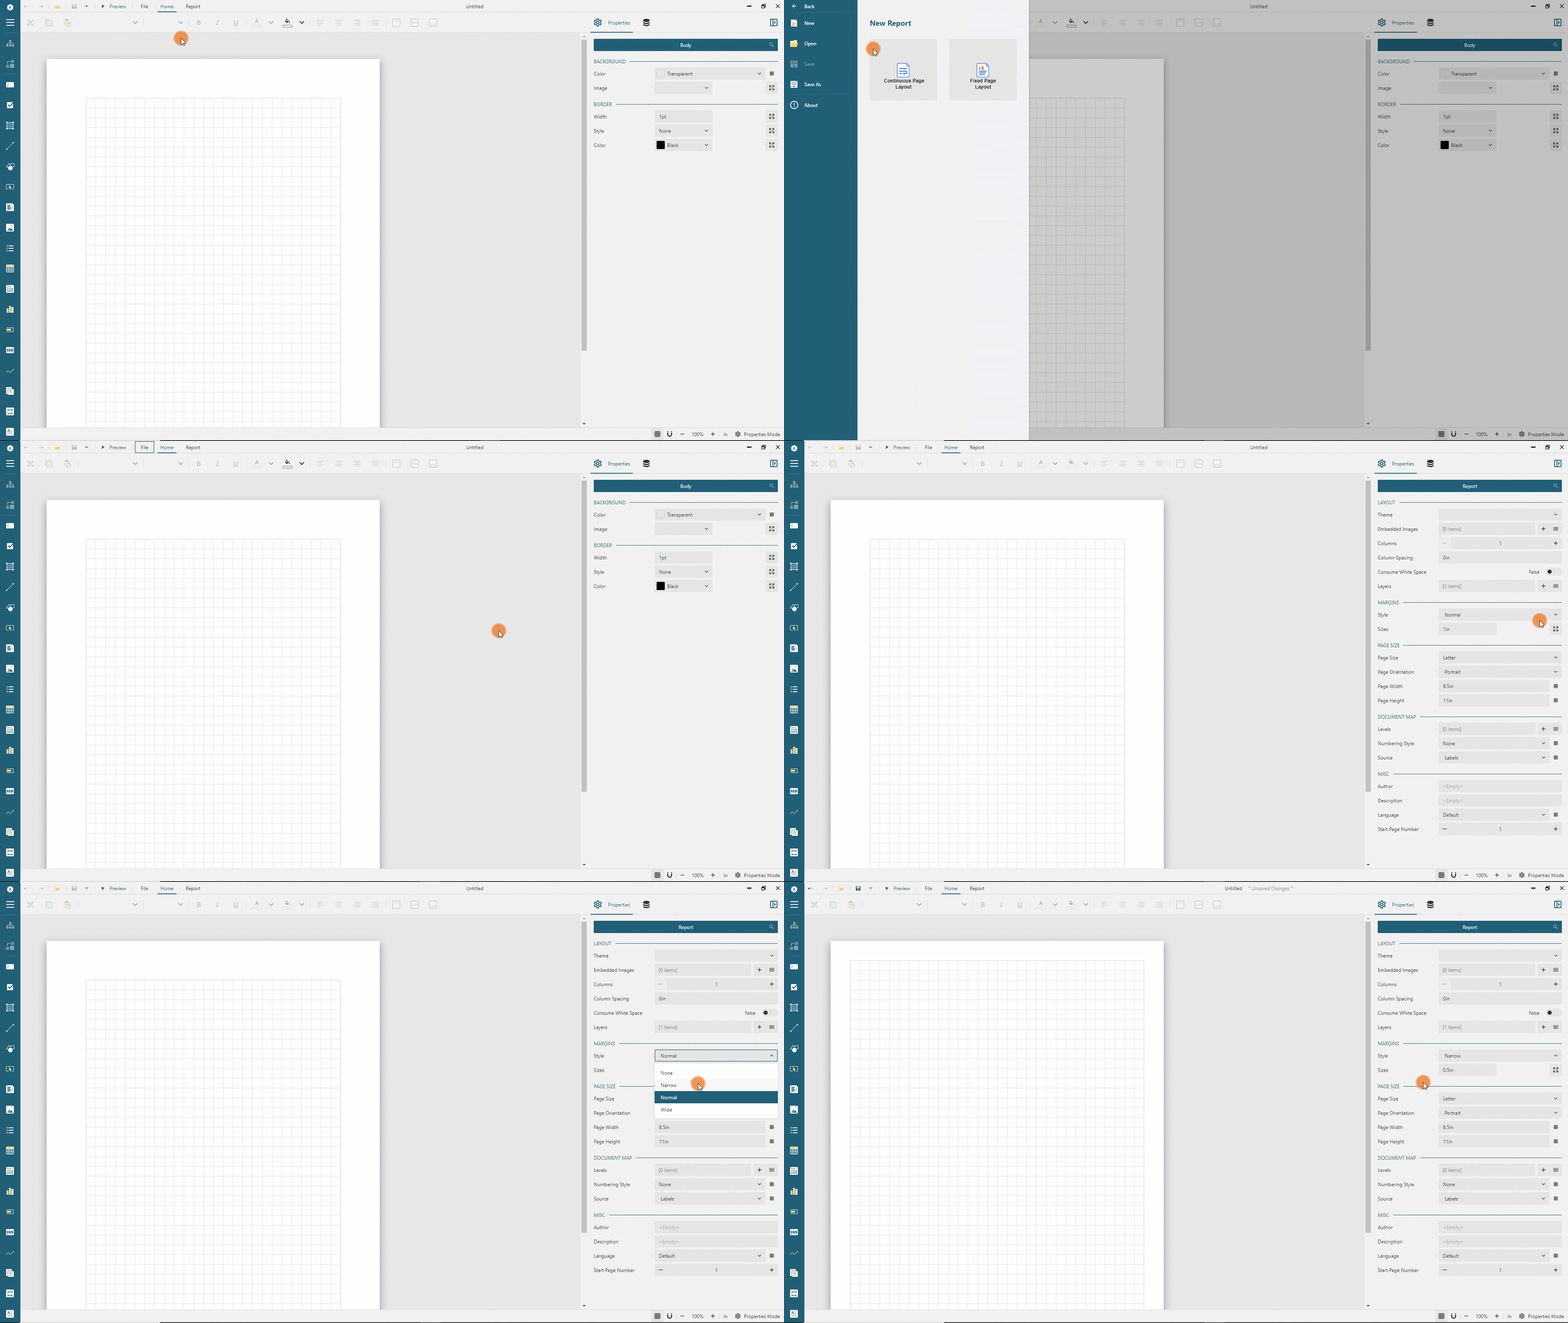
In the standalone report designer, click the File menu and select the Continuous Page Layout template for a newly created report. Click anywhere on the gray area around the report layout to load the report properties in the Properties panel. In the Margins section, set the Style property to Narrow to change the report page margins size.
Expand to watch creating a new report in action
Data Binding
Data binding establishes a connection between a report and the data it displays. In this tutorial, we use the MESCIUS Demo OData API that contains the sales data for a fictitious company called Contoso that is a manufacturing, sales, and support organization with more than 100,000 products.
Adding Data Source
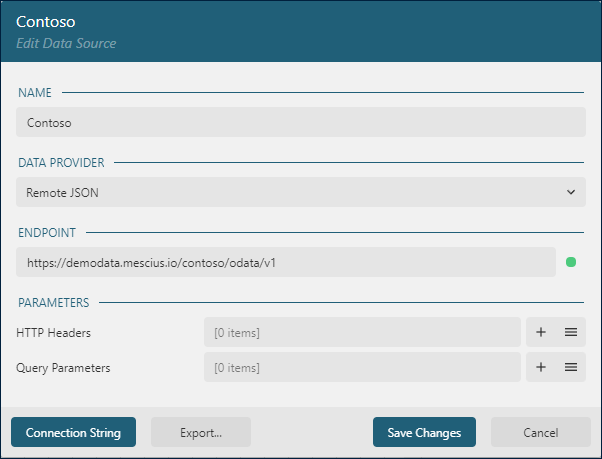
You can think of the Contoso OData API as the "database" that you can connect to using its root URL https://demodata.mescius.io/contoso/odata/v1, and that has multiple "tables" which presented with endpoints such as /DimCustomers, /DimStores, and /DimProducts. You can create a Report DataSource that establishes the connection to such a "database" using the following steps.
Open the Data panel of the property inspector and click the
Addbutton.In the Data Source editor dialog, type
Contosoin the NAME field andhttps://demodata.mescius.io/contoso/odata/v1in the ENDPOINT field.Click the
Save Changesbutton
Adding Data Sets
Data Sets represent one or more endpoints of the Data Source. For the Drillthrough Sales Report, we need to have access to the data from the /DimChannels and /FactSales endpoints of the Contoso Data Source that we added in the previous section.
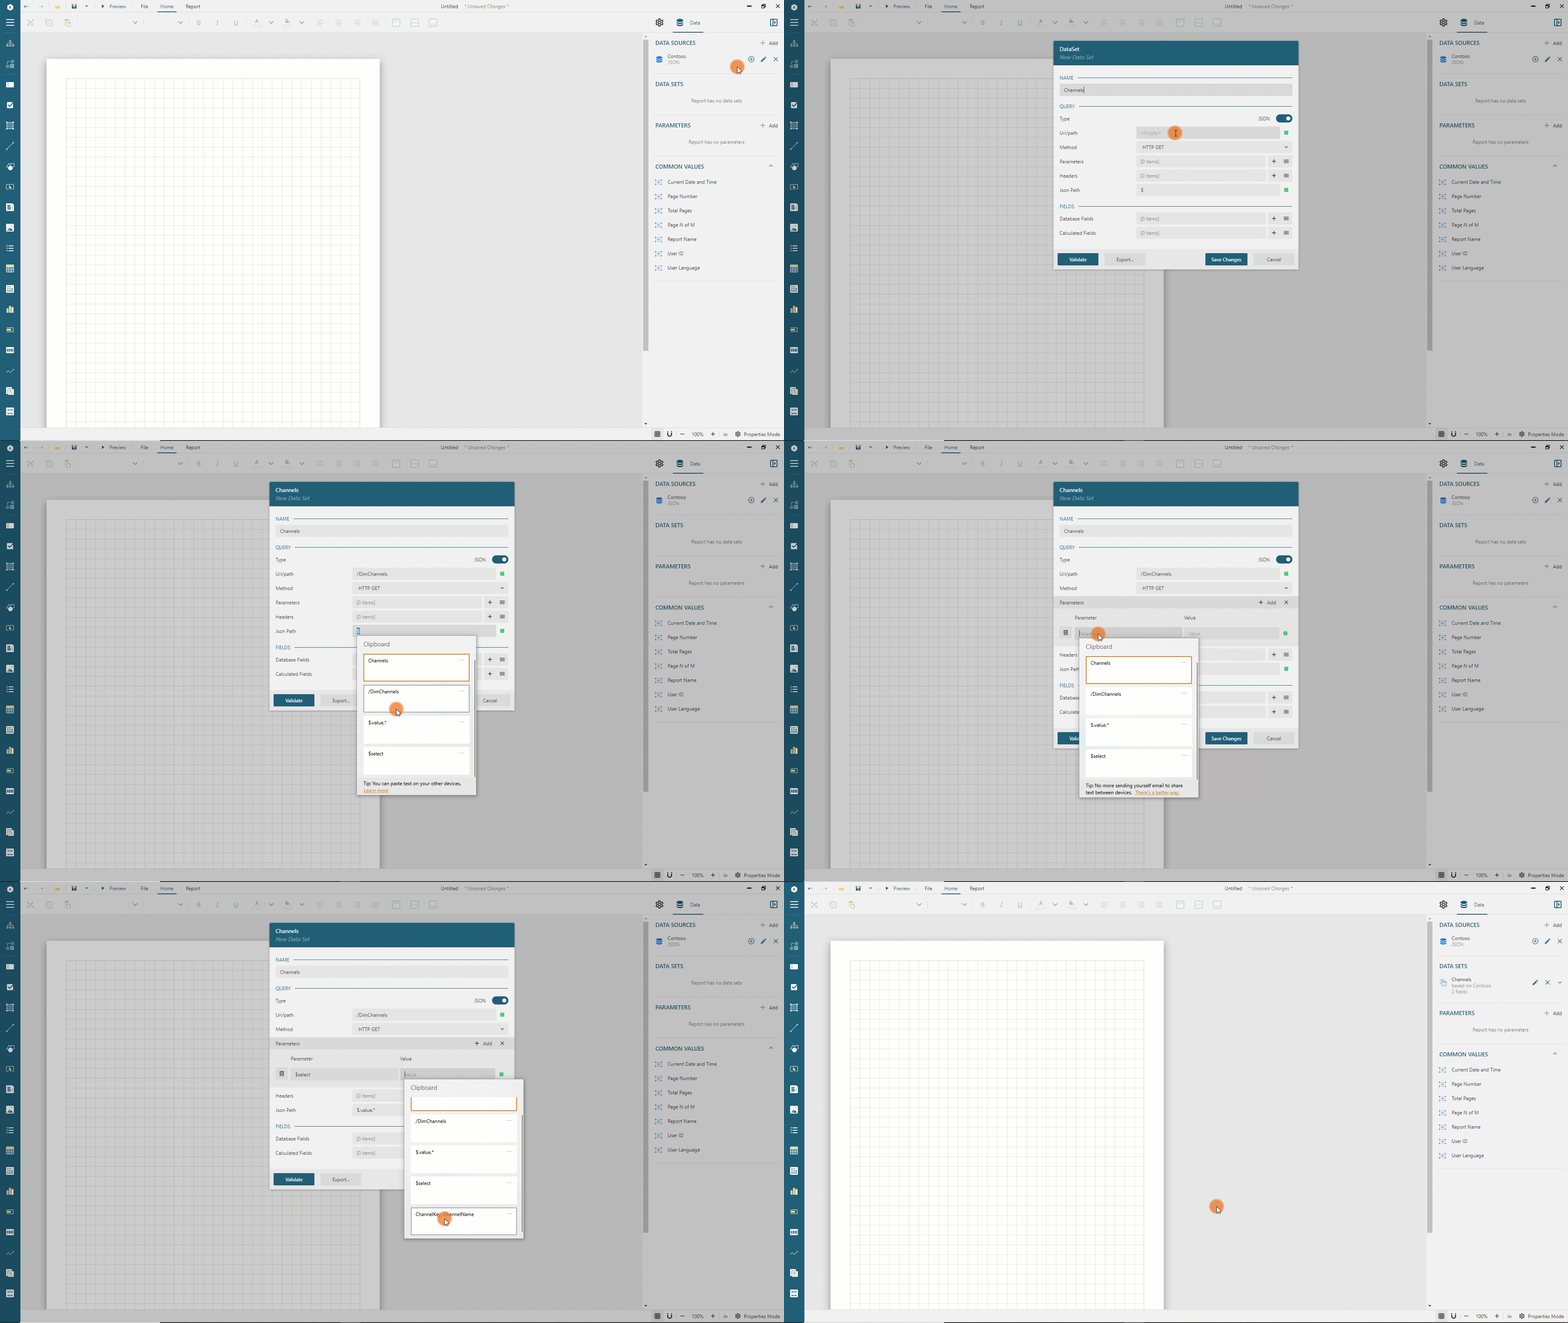
Use the following steps to add the Channels data set:
Click the
+icon nearContosoin the Data panel.In the Data Set Editor dialog, type
Channelsin the NAME field,/DimChannelsin the Uri/Path field, and$.value.*in theJson Pathfield.By default, each
Channelrecord includes seven fields, but we don't need them all. Therefore we limit the retrieved fields by applying the OData $select query option via a query parameter.Click the
+icon on the right side of theParameterssection.Type
$selectin theParameterfield of the newly addedParameteritem.Type
ChannelKey, ChannelNamein theValuefield of the sameParameteritem.
Click the
Validatebutton.Ensure that the
DataBase Fieldssection displays[2 items]text.Click the
Save Changesbutton.
Expand to watch adding the Channels data set in action
Next, add the Sales data set with the same approach:
Click the
+icon nearContosoin the Data panel.In the Data Set Editor dialog, type
Salesin the NAME field,/FactSalesin the Uri/Path field, and$.value.*in the Json Path field.By default, each
FactSalesrecord includes 19 fields, but we don't need them all. Therefore we limit the retrieved fields by applying the OData $select query option via the query parameter.Click the
+icon on the right side of theParameterssection.Type
$selectin theParameterfield of the newly addedParameteritem.Type
DateKey, ChannelKey, SalesAmountin theValuefield of the sameParameteritem.
Click the
Validatebutton.Ensure that the
DataBase Fieldssection displays[3 items]text.Click the
Save Changesbutton.
Saving report templates
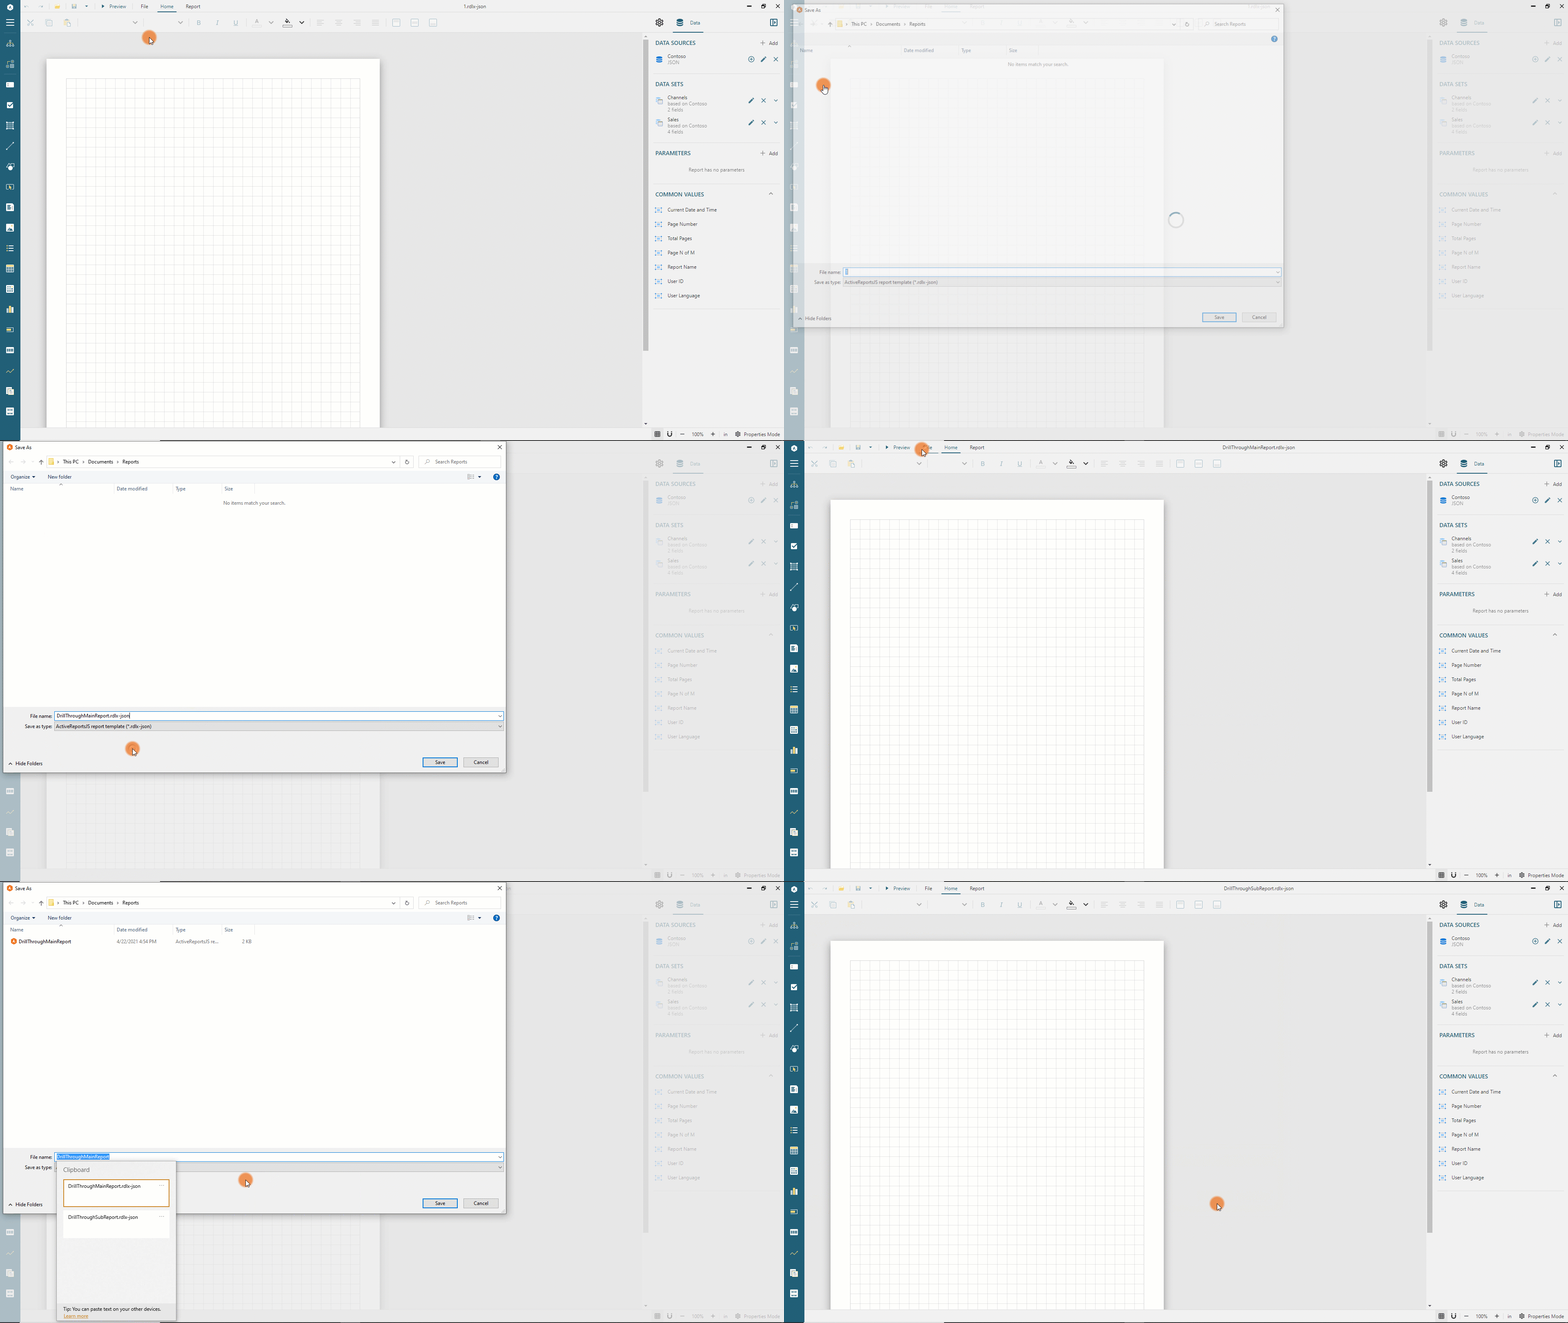
The report template that we created is the starting point of both the main report and the subreport. Hence, it's convenient to save this template to two files:
In the standalone report designer, open the File menu, then click the
Save Asitem on the sidebar and save the report underDrillThroughMainReport.rdlx-jsonname in the directory of your choice.Repeat the same operation to save the report template under
DrillThroughSubReport.rdlx-jsonin the same directory.
Expand to watch saving report templates in action
Adding Subreport Parameters
A drill-through link between the main report and a subreport has two properties:
The subreport name
The collection of subreport parameter values
The subreport accepts these parameter values and filters the visualized data accordingly.
In this step, we add two parameters that will filter the data displayed in DrillThroughSubReport.rdlx-json report:
In the Data panel click the
+ Addbutton in theParametersSection.Type
SalesYearin theNamefield.Select
Integerin theData Typedrop-down.Click the
Hiddenswitch to prevent the parameter input from being shown to a report reader.In the
Default Valuesection, select theNon-queriedtab, expand theValuescollection, click theAdd Itembutton, and type2007in the newly added field.
Expand to watch adding the SalesYear parameter in action
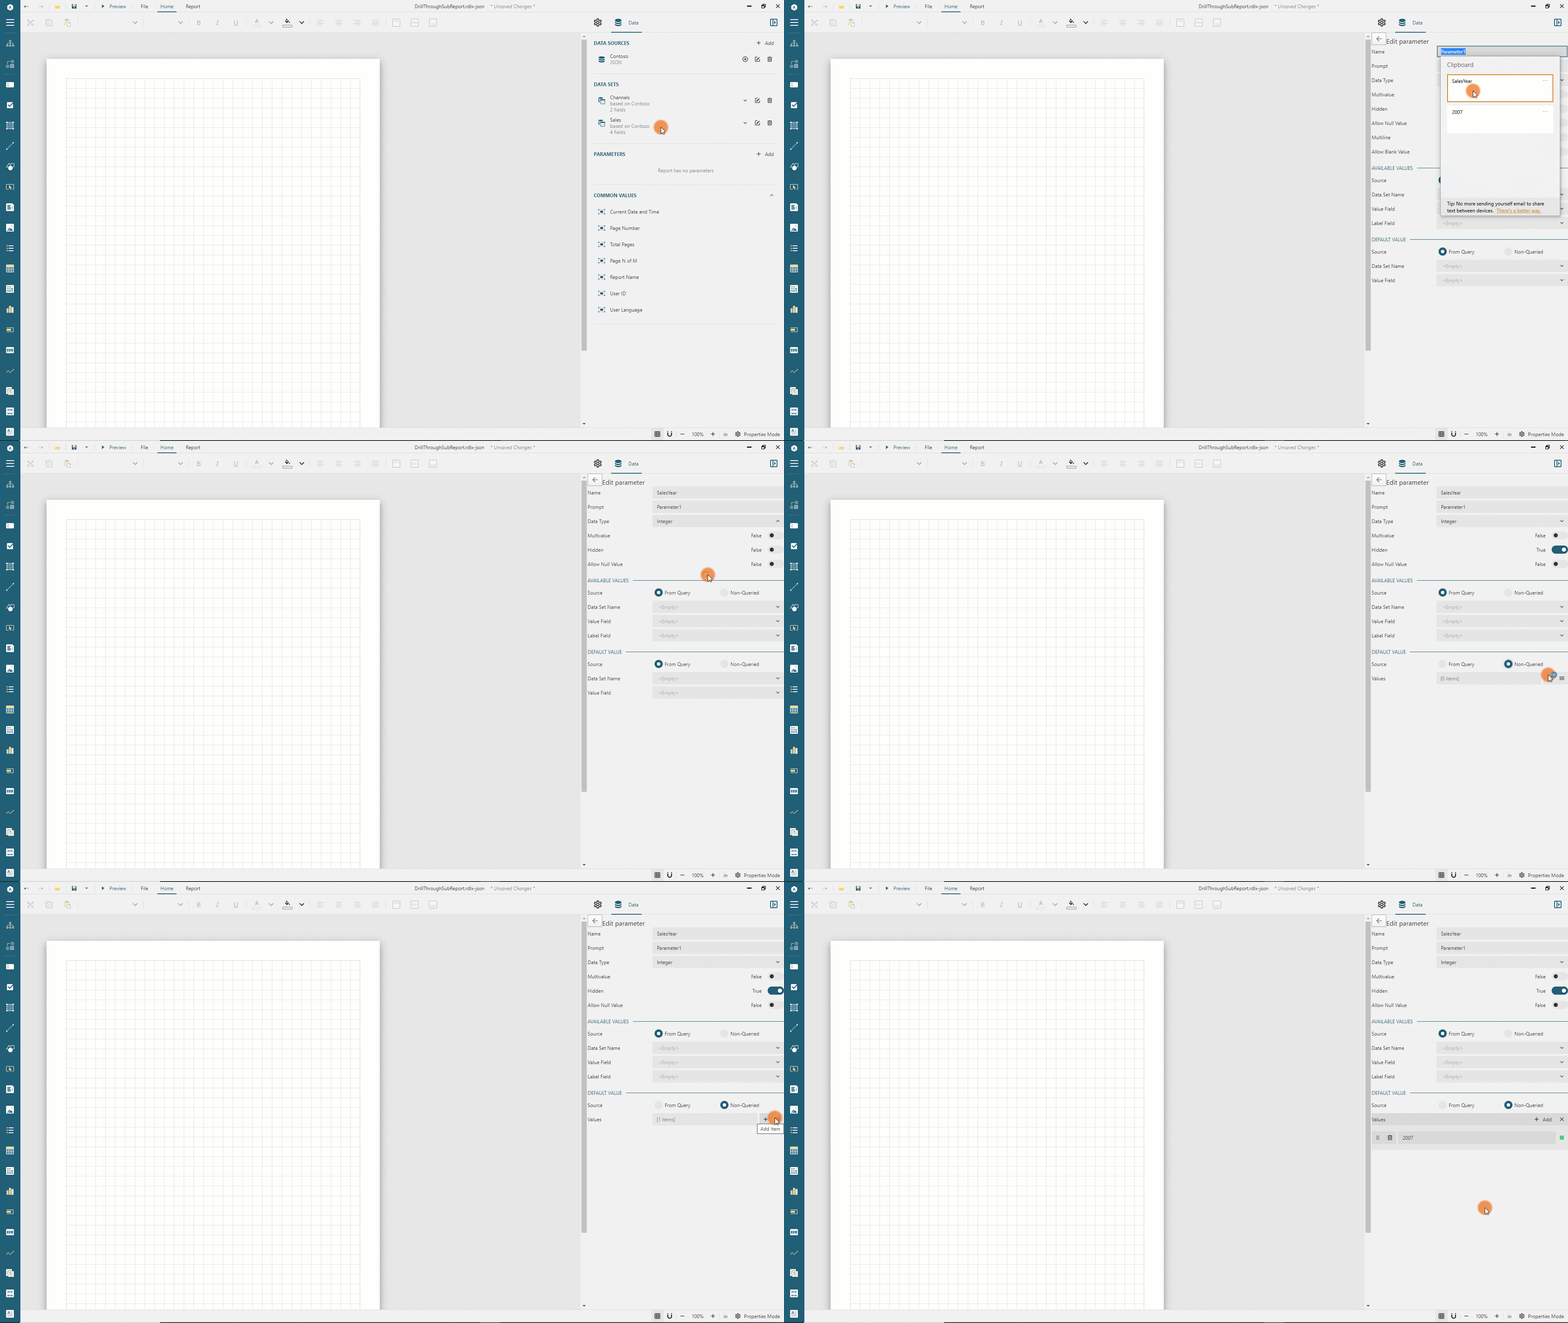
Using the same approach, add the ChannelKey parameter:
Click the
Left Arrowicon near theEDIT PARAMETERheader.In the Data panel, click the
+ Addbutton in the Parameters Section.Type
ChannelKeyin theNamefield.Select
Integerin theData Typedrop-down.Click the
Hiddenswitch to prevent the parameter input from being shown to a report reader.In the
Default Valuesection, select theNon-queriedtab, expand theValuescollection, click theAdd Itembutton and type2in the newly added field.
Modifying the Subreport DataSet
The DrillThroughSubReport.rdlx-json should display monthly sales for the given sales year and channel. Thus, we should modify the Sales data set by adding the $filter option in the query parameters.
Click the
Left Arrowicon near theEDIT PARAMETERheader.Click the
Pencilicon nearSalesin the Data panel.Click the
+icon on the right side of theParameterssection.Type
$filterin theParameterfield of the newly addedParameteritem.Type
ChannelKey+eq+{@ChannelKey}+and+Year(DateKey)+eq+{@SalesYear}in theValuefield of the sameParameteritem.Click the
Validatebutton.In the Parameter Prompt that appears, type
2in the@ChannelKeyfield,2007in the@SalesYearfield and click theSave & Runbutton.Ensure that the
DataBase Fieldssection displays[3 items]text.
Adding Line Chart
To display monthly sales data, we use the Line Chart:
Expand the toolbox using the
Hamburgermenu located on the left side of the toolbar.Drag and drop the
Chartitem from the toolbox to the report page area's top-left corner.Switch to the Properties panel in the Property inspector.
Select the
Lineitem in thePlot Templatedrop-down menu. The property panel automatically displays properties of the Chart Plot.
Expand to watch adding the Line Chart in action
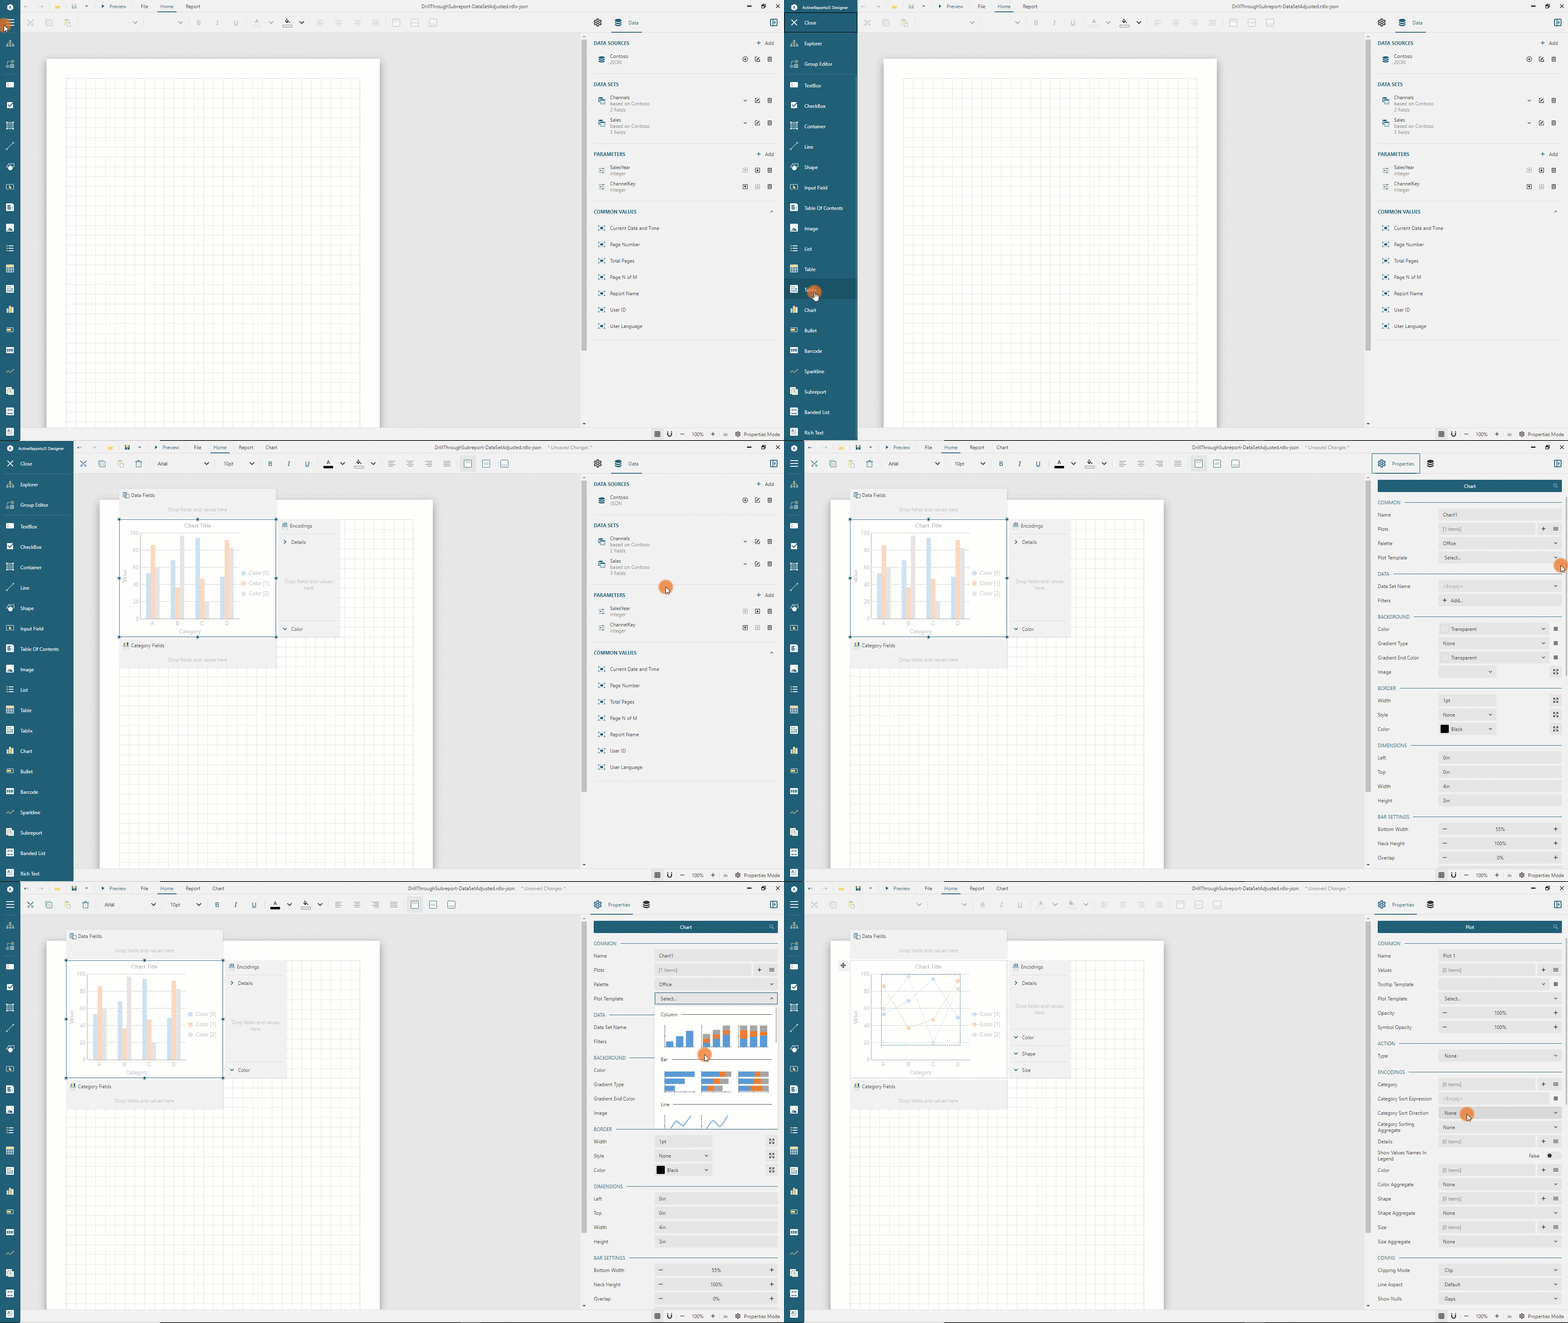
Configuring Line Chart Plot
The plot properties define the visualization of actual data within a chart. Follow the next steps to configure the line chart plot.
In the Properties panel, expand the
Valueseditor using theListicon on the right side.Click the
Add Itembutton and open the newly added value editor using thegearicon on the right side.Expand the
Valueslist using theListicon on the right side.Click the gray box on the right side of the default value and choose the
SalesAmountelement in the drop-down menu.Choose
Sumin theAggregatedrop-down.
Expand to watch configuring the plot value in action
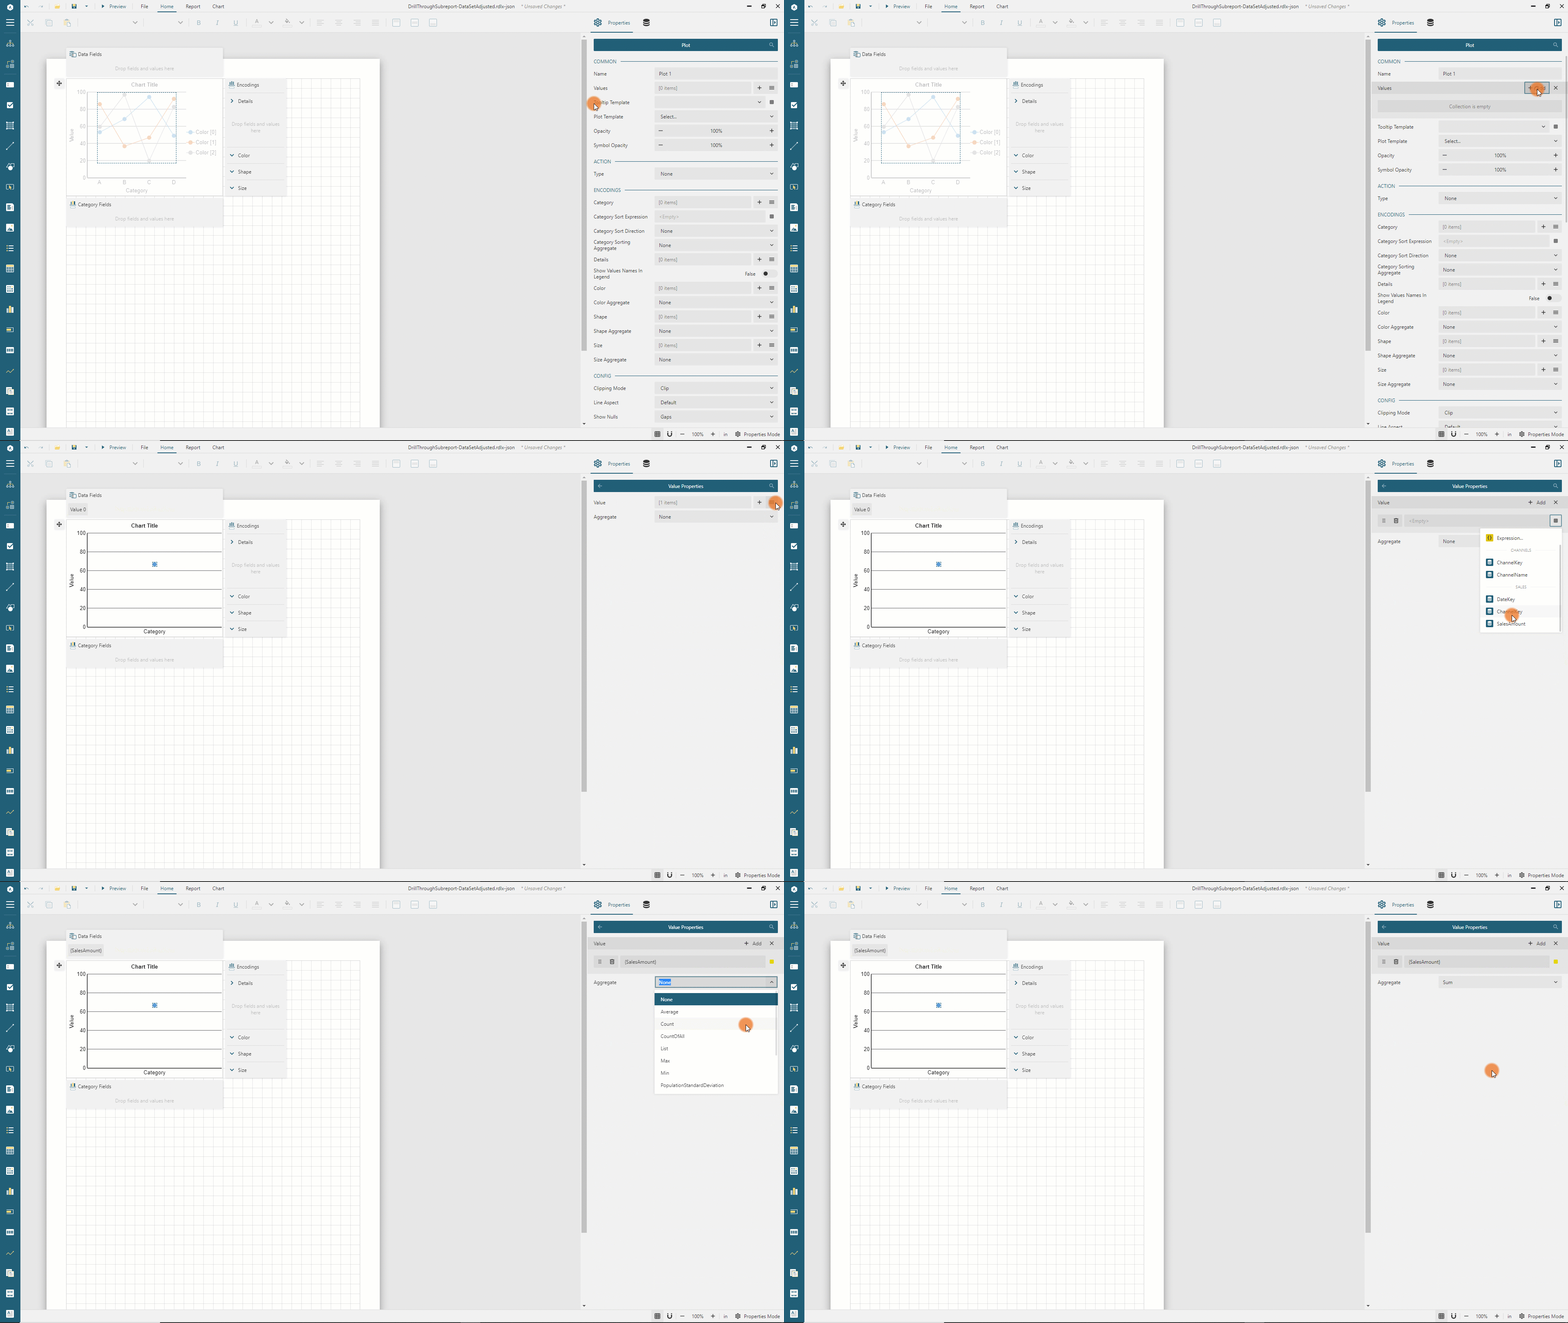
In the same manner, configure the plot category:
Return to the Plot properties using the
Left Arrowicon near theValue Propertiesheader.Expand the
Categoryeditor in theEncodingssection using theListicon on the right side.Type
{MonthName(Month(DateKey))}in the default category field.Type
{Month(DateKey)}in theCategory Sort Expressionfield.Select
Ascendingin theCategory Sort Directiondrop-down.
Thus, the plot will display the sum of sales amounts for each month extracted from many DateKey values. Months will appear in the natural order, from January to December.
Next, configure the line appearance:
Scroll down to the
Stylesection and set theLine ColortoBlackand theLine Widthto2pt.In the
Symbolssection, chooseDotfor theSymbol Shapeproperty,Whitefor theBackground Colorproperty, andSolidforStyleproperty.
You can now preview the report output and see how the plot we just configured displays monthly sales using dots connected with the line.
Configuring Line Chart appearance
The report explorer provides a convenient way to navigate through report parts and load their properties for modification.
Click the Explorer icon on the toolbox and pin the Explorer panel. You can see the report hierarchy, and if you select a node, its properties appear in the properties panel.
Click the Chart item and set the Width property to 7.5in and the Height property to 6in in the property panel.
Expand to watch setting chart dimensions in action
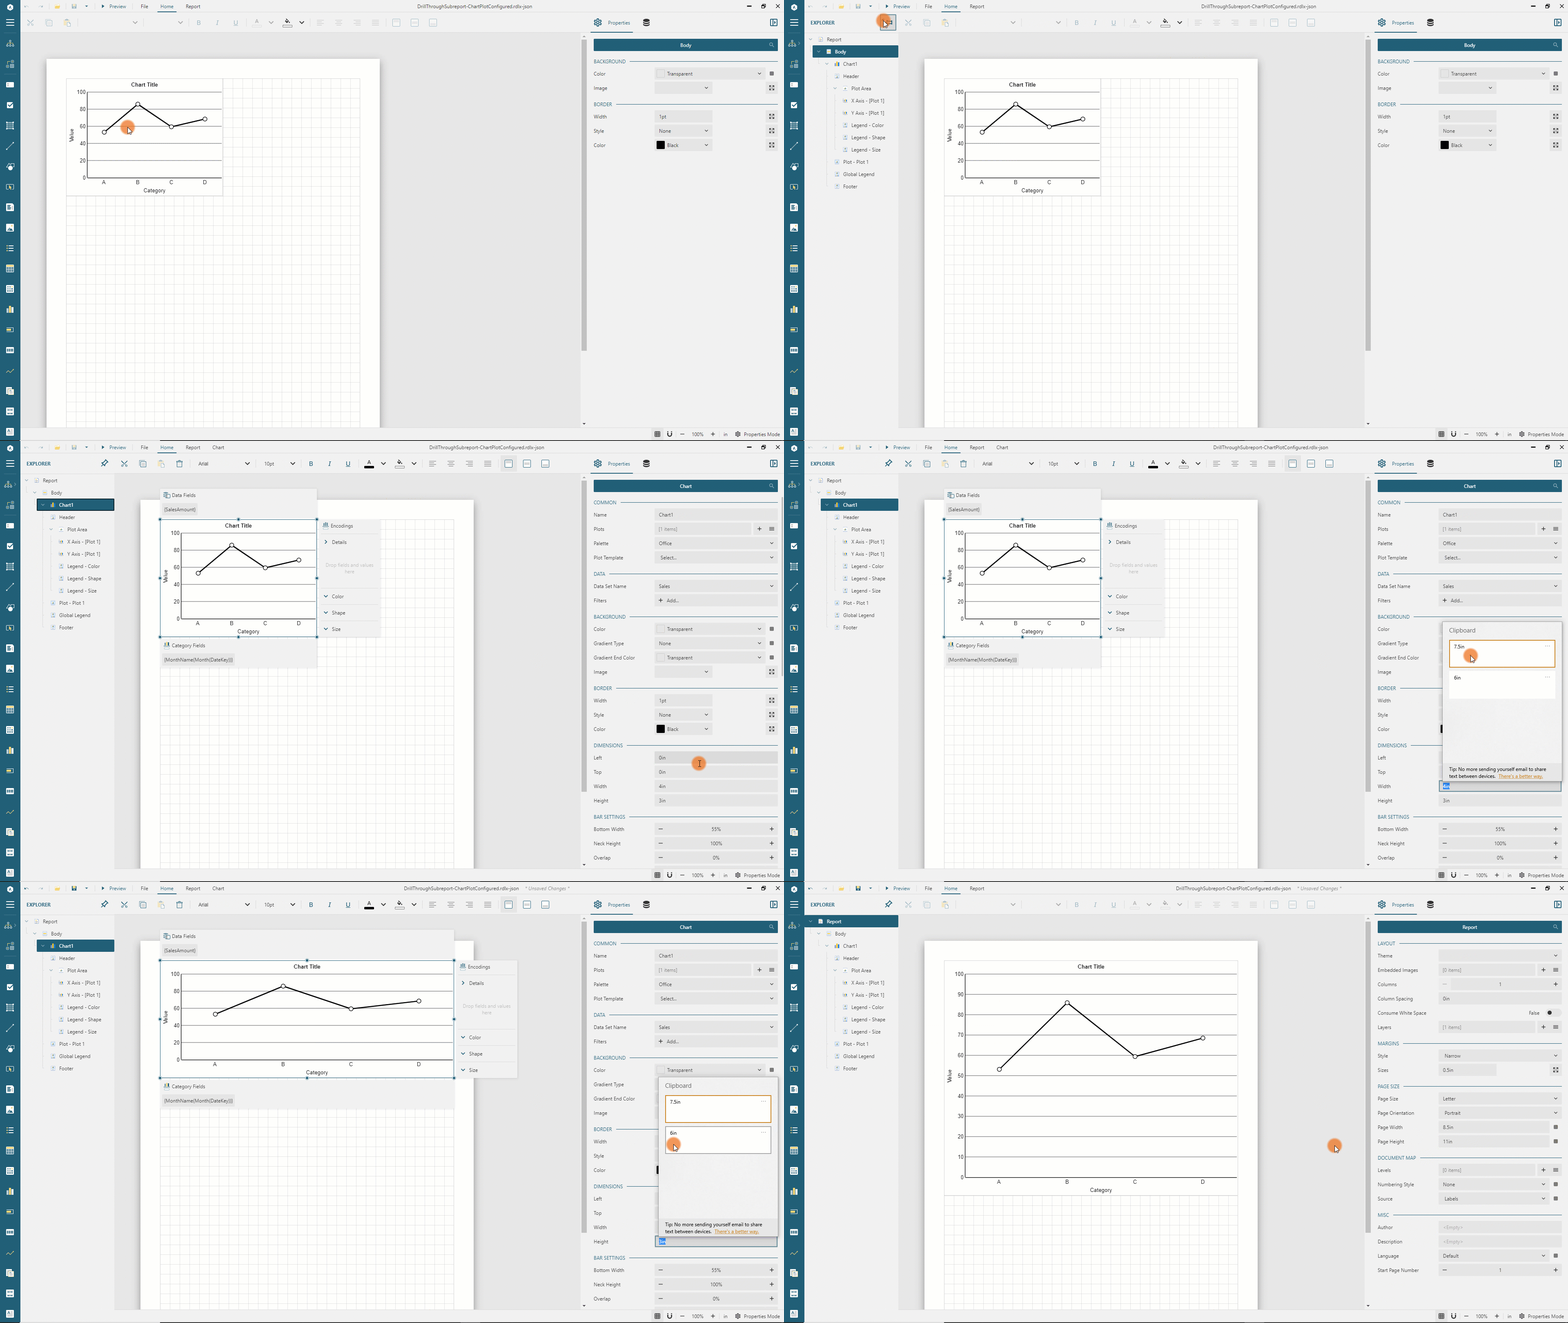
Similarly, set the properties of the X Axis - [Plot 1], and Y Axis - [Plot 1] chart sub-items according to tables below. Check the Chart Axes documentation for the detailed explanation of these properties.
X Axis - [Plot 1]
Property | Value |
|---|---|
Title | Empty string(Reset the default value) |
Line Visible | False |
Labels Color | #1a1a1a |
Labels Angle | -45 |
Major Grid/Show Grid Lines | True |
Major Grid/Width | 0.25pt |
Major Grid/Color | #ccc |
Y Axis - [Plot 1]
Property | Value |
|---|---|
Title | Empty string(Reset the default value) |
Line Visible | False |
Labels Color | #1a1a1a |
Labels Format | c2(select Currency in the drop-down) |
Major Grid/Show Grid Lines | True |
Major Grid/Width | 0.25pt |
Major Grid/Color | Gainsboro |
Major Grid/ Major Interval | 20000 |
The chart might look distorted at design-time, but you can preview the report output and notice that it looks sharp.
Configuring Line Chart Header
The chart header should display the information about the data's sales channel and year. These values are available as the report parameters values so that we could use the Monthly {@ChannelKey} Sales in {@SalesYear} Expression, but the ChannelKey is the integer value, and we want to display the actual sales channel name. We will use the Lookup function to resolve the Channel Name by its Key.
Click the
Chart1 -> Headeritem in the report explorer.Set the
Captionproperty toMonthly {Lookup(@ChannelKey, ChannelKey, ChannelName, "Channels")} Sales in {@SalesYear}expression. TheLookupfunction takes the value of the first argument - theChannelKeyparameter value - finds the row with the sameChannelKeyin theChannelsdata set and returns the correspondingChannelName.Also, set the
Text Colorof the chart header to#3da7a8, theFont Sizeto22pt, and then theFont WeighttoBold.
You can preview the report output and notice that the chart header displays the Monthly Online Sales in 2007 header.
We finished configuring the drill-through subreport. Go back to the report design, and save the progress using the Save button of the standalone report designer.
Next, open the previously saved DrillThroughMainReport.rdlx-json using the Open button of the File menu.
Adding Stacked Column Chart and Configuring its Plot, Appearance, and Header
The main report of the drill-through navigation uses the stacked column chart to display the annual sales data:
Expand the toolbox using the
Hamburgermenu located on the left side of the toolbar.Drag and drop the
Chartitem from the toolbox to the report page area's top-left corner.Switch to the Properties panel in the Property inspector.
Select the
Column Stackedin thePlot Templatedrop-down menu. The property panel automatically displays chart plot properties.In the Properties panel, expand the
Valueseditor using theListicon on the right side.Click the
Add Itembutton and open the newly added value editor using thegearicon on the right side.Expand the
Valueslist using theListicon on the right side.Click the gray box on the right side of the default value and choose the
SalesAmountelement in the drop-down menu.Choose
Sumin theAggregatedrop-down.Return to the Plot properties using the
Left Arrowicon near theValue Propertiesheader.Expand the
Categoryeditor in theEncodingssection using theListicon on the right side.Type
{Year(DateKey)}in the default category field.Type
{Year(DateKey)}in theCategory Sort Expressionfield.Select
Ascendingin theCategory Sort Directiondrop-down.
Set the following properties for the Chart1 item using the Report Explorer as it was explained in the Configuring Line Chart appearance section above:
Property | Value |
|---|---|
Width | 7.5in |
Height | 7.5in |
For the X Axis - [Plot 1] item:
Property | Value |
|---|---|
Title | Empty string(Reset the default value) |
Line Visible | False |
For the Y Axis - [Plot 1] item:
Property | Value |
|---|---|
Title | Empty string(Reset the default value) |
Line Visible | False |
Labels Color | #3c3c3c |
Labels Format | c2(select Currency in the drop-down) |
Major Grid/Show Grid Lines | True |
Major Grid/Width | 0.25pt |
Major Grid/Style | Dashed |
Major Grid/Color | #ccc |
Major Grid/ Major Interval | 50000 |
And for the Header item:
Property | Value |
|---|---|
Caption | Annual Sales by Channel |
Font Size | 20pt |
Font Weight | Bold |
Configuring Stacked Column Chart Details
You can now preview the report output and notice that it displays the sum of sales for each year, but it also should split each column among sales channels and show the legend. To achieve that, we use the Details Encoding, Colors Encoding, and the Legend configuration :
Go back to the report design select the
Plotitem in the Report Explorer.Expand the
Detailseditor in theEncodingssection using theListicon on the right side.Click the
Add Itembutton and open the newly added value editor using thegearicon on the right side.Expand the
Valueslist using theListicon on the right side.Click the gray box on the right side of the default value and choose the
ChannelKeyelement in the drop-down menu.Return to the Plot properties using the
Left Arrowicon near theDetails Propertiesheader.Expand the
Coloreditor in theEncodingssection using theListicon on the right side.Click the
Add Itembutton and type{Lookup(ChannelKey, ChannelKey, ChannelName, "Channels")}in the newly added item field. This usage of theLookupfunction is similar to the one for the Line Chart header described earlier.Select the
Legend - Coloritem in the Report Explorer.Set the
Orientationproperty toHorizontaland thePositionproperty toTopin theLayoutsection.
Displaying Plot Labels and Tooltips
You can now preview the report output and notice that each column splits into four colored parts that correspond to the sales channels, and the legend helps to match the color with the channel name. To improve the data visualization, we configure the Plot Labels and Tooltips appearance:
Go back to the report design select the
Plotitem in the Report Explorer.Select the
Color Field Valueitem in theTooltip Templatedrop-down in theCommonsection.Click the gray box on the right side of the
Templateeditor in theLabel Textsection of the Properties panel and select theExpression...item. The Expression Editor will appear. Type{valueField.value:C2}in the expression text area and click theSavebutton.Set the
Label Text/Positionproperty toCenter
Expand to watch configuring plot tooltips and labels in action
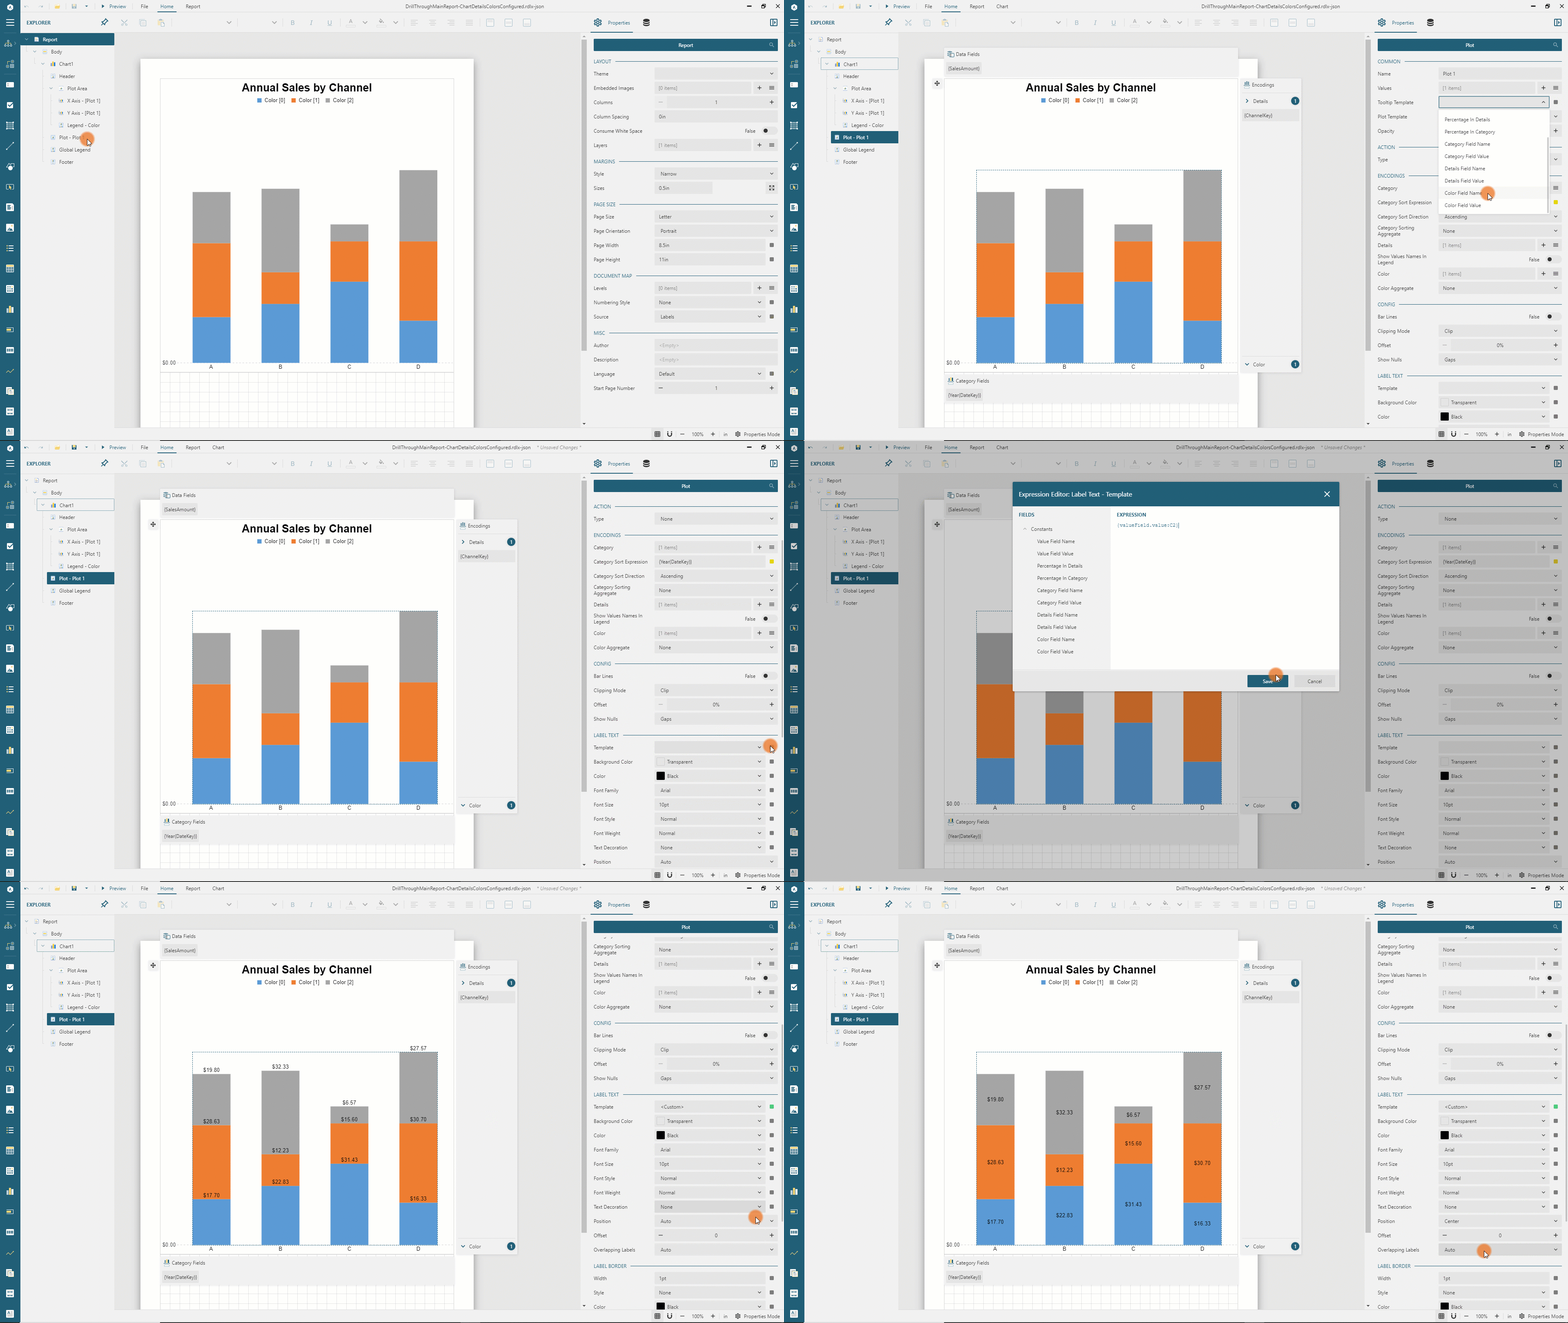
You can now preview the report output and notice that the chart columns display the sales amount for each channel and year, and the channel name tooltip shows up when the mouse is over a column.
Configuring Drill-Through link
Finally, we configure the link between the main report and subreport for the drill-through navigation.
Go back to the report design select the
Plotitem in the Report Explorer.Select the
Jump to Reportin theTypeeditor of theActionsection.In the
Jump to Reporteditor select theDrillThroughSubReport.rdlx-jsonitem.Expand the
Parameterseditor using theListicon on the right side.Click the
Add Itembutton and open the newly added value editor using thegearicon on the right side.Type
ChannelKeyin theParameter Namefield and select theChannelKeyitem in theValuedrop-down.Return to the Plot properties using the
Left Arrowicon near theParameter Propertiesheader.Similarly add another parameter with
SalesYearname and{Year(DateKey)}value.
You can now preview the report output and click any column and notice that the report viewer opens the subreport with the detailed data on the selected sales year and channel as per drill through configuration. You can go back using the Go Back in History report viewer toolbar button. You can also click the rightmost button, called Galley Mode. It switches the viewer mode to display the unpaginated output that is suitable for reading drill-through reports.
The final version of report is available at the demo web-site.


