Templates
Report generation is crucial for creating marketing strategies, project management, product development cycles, budgeting estimates and growth strategies. It is a common requirement of any business domain. Excel reports are periodically generated and consume a considerable amount of time and effort. However, the chances of manual error cannot be eliminated altogether. That's where the use of templates finds its place. DsExcel provides templates to create highly effective and well-designed Excel reports.
Some of the powerful features provided by DsExcel templates are as follows:
Flexible: DsExcel templates have a highly flexible template syntax and API to bind Excel documents to data. It follows easy data population rules in fields.
Efficient: DsExcel templates provide extended reusability. This means the templates can be used with minor modifications, or as it is time and again, saving both time and effort.
Multi-platform: DsExcel templates are supported on Windows, Linux and macOS.
Multi-domain: DsExcel templates cater to complex use-cases to create Excel reports for any scenario.
The DsExcel template is a pre-defined and formatted workbook. It can be used in the creation of final reports. In the following sections, you will find DsExcel templates used in three diverse use-cases.
Use Case 1 - Financial Statistics Report
In this use-case, we have created a Financial dashboard template to show the Budget statistics of different countries in different seasons or quarters. Here, in the template, the cell A1 contains the title of the template, and the cell D1 contains the year gap for which the financial data has been recorded. Note that here 'ds' is the data source that will populate the country names and quarterly seasons in the Excel report. The names such as BUDGET STATISTICS, BUD and ACT are other data fields of ds. The country field is expanded horizontally to add other countries. Various function fields are used to perform calculations on the Budget and Actual columns.
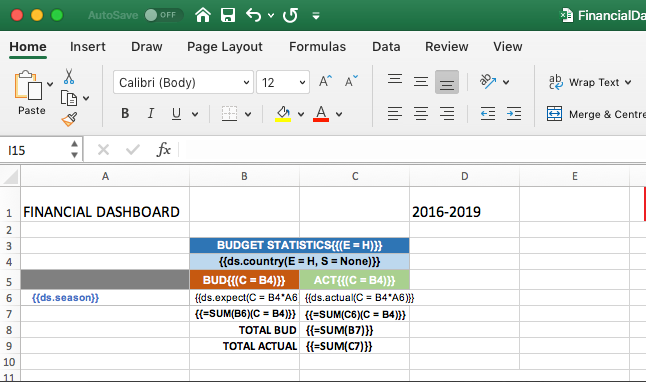
The Excel report generated from the Financial Dashboard template is given below:
.png)
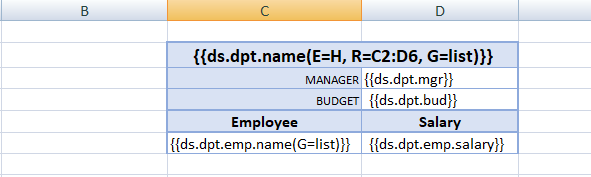
Use Case 2 - Department & Budget Report
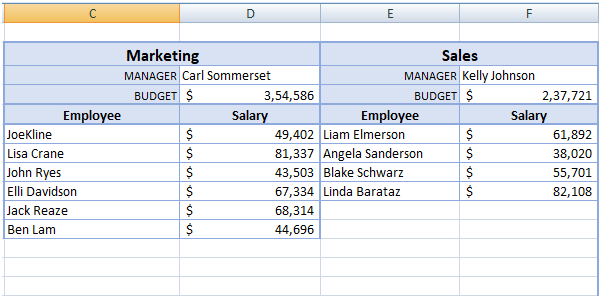
In this template, the budget of each department is depicted based on the salaries of employees in that department. Here, 'ds' is the data source and it populates data fields with the names of departments, managers and employees. The department data fields are expanded horizontally to add more departments. Note that in each department, the static text fileds 'Employee' and 'Salary' remains the same. The image below shows the budget report for two departments, Marketing and Sales.
The Excel report generated from the Department & Budget template is given below:
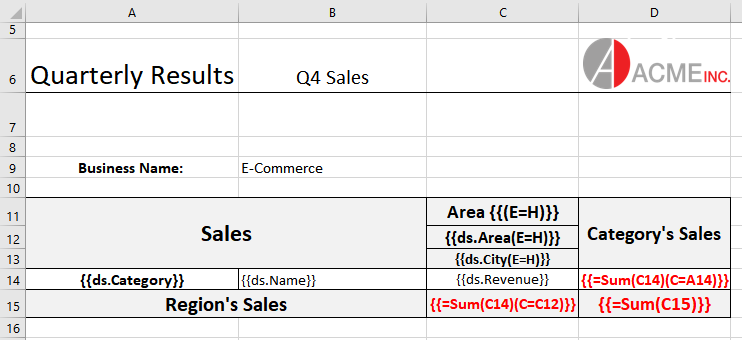
Use Case 3 - Sales Report
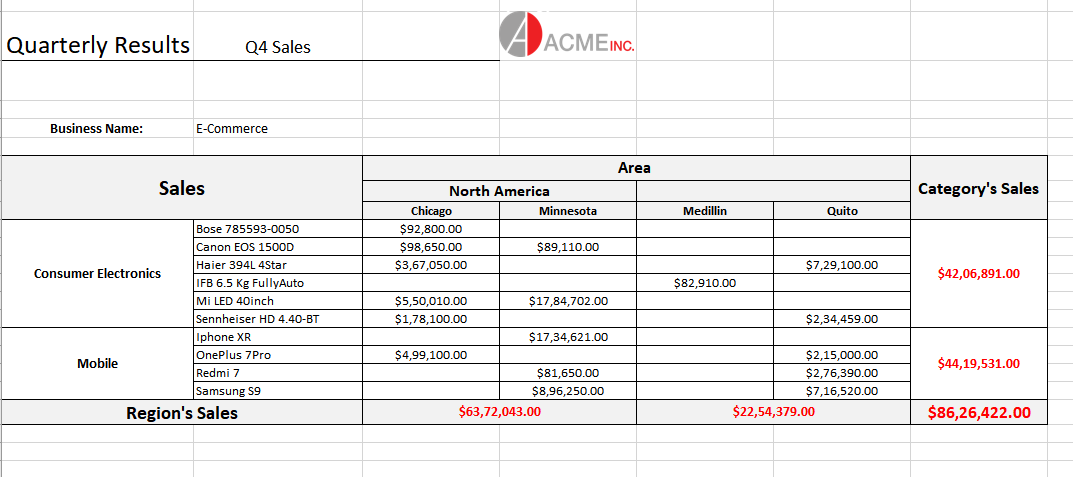
This use case depicts a template for recording the E-commerce sales of electronic goods in different areas of a country. The data source used here is ds, and it populates the data in the final Excel report with categories, names, cities, sales etc.
The Excel report generated in this case displays the sales of electronic goods individually as well as with respect to their categories. The area and cities are expanded horizontally due to their expansion property. Various function fields are used to perform calculations on the sales and revenue numbers. The value in cell D14 is calculated, first by summing up the revenue in cell C14 and then summing up the values of the whole category (as A14 is its context)
The Excel report generated from the Sales template is given below: