- 2D Chart for WinForms Overview
- Key Features
- Chart for WinForms Quick Start
- Design-Time Support
- Chart Fundamentals
- Common Usage for Basic 2D Charts
- Specific 2D Charts
- Design-Time Tools for Creating 2D Charts
- Charting Data
- Data Binding
- Charting Labels
- Chart Area and Plot Area Objects
- Customizing Chart Elements
- Loading and Saving Charts, Data, and Images
- End-User Interaction
- Chart for WinForms Samples
- Chart for WinForms Tutorials
- Chart for WinForms Task-Based Help
Special Radar Chart Properties
The Radar chart has special properties to chart the degrees of the Radar, set the starting angle, create filled radar chart.and whether or not to use flat Y coordinate gridlines for radar charts.
Charting Degrees or Radians
The Start property of the Radar class sets whether the Start property value for radar charts reflects angles in degrees (True) or radians (False). The Degrees property can be accessed at design time through the Radar node of the ChartGroups Collection Editor.
Setting the Starting Angle
The Start property of the Radar class sets the starting angle for radar charts. The default setting for this property is 0. Setting this property to a value other than 0 will move the origin of the chart counter-clockwise by the specified degrees. For instance, setting the Start property to 90, the Radar chart rotates 90 degrees in the counter-clockwise direction.
Filled Radar Charts
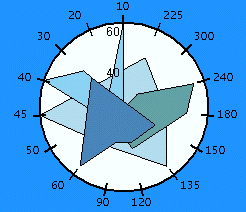
A Filled Radar chart draws the y value in each series along a radar line (the x value is ignored except for labels). If the data has n unique points, the chart plane is divided into n equal angle segments, and a radar line is drawn (representing each point) at n/360 degree increments. Each series is drawn "on top" of the preceding series. The series can be drawn independently or stacked. Filled Radar charts are the same as Radar charts, except that the area between the origin and the points is filled and symbols are not present. To create a Filled Radar chart, set the Filled property of the Radar class to True.

Flat Gridlines
You can show flat Y coordinate gridlines in radar charts by setting the FlatGridLines property to true.

To programmatically set the FlatGridLines property to true:
To write code in Visual Basic
C1Chart1.ChartGroups(0).Radar.FlatGridLines = True
To write code in C#
c1Chart1.ChartGroups[0].Radar.FlatGridLines = true;


