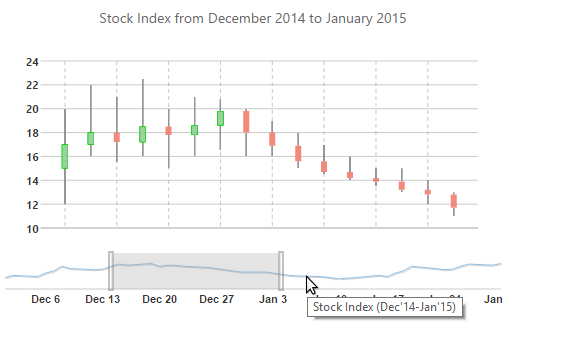
You can customize the tooltip content of ChartNavigator. By default, it displays the value of X-axis when you hover on it. You can also add your customized text that you want to display.
For example, the following steps sets the value of tooltip to Stock Index (Dec'14-Jan'15) using the sample created in the Quick Start section:
Set the Tooltip text inside the <cC1:C1ChartNavigator> tag to display tooltip.
| Source View |
Copy Code
|
|---|---|
<cC1:C1ChartNavigator ID="C1ChartNavigator1" runat="server" ToolTip="Stock Index (Dec'14-Jan'15)"> |
|
Add the following code to the Page_Load event to customize tooltip of the ChartNavigator.
| C# |
Copy Code
|
|---|---|
C1ChartNavigator1.ToolTip = "Stock Index (Dec'14-Jan'15)";
|
|
| VB |
Copy Code
|
|---|---|
C1ChartNavigator1.ToolTip = "Stock Index (Dec'14-Jan'15)"
|
|
When you run your application, the ChartNavigator appears as shown in the image below:
