In This Topic
BubbleChart for ASP.NET Web Forms provides the following unique key features:
- HTML5
What makes these charts superior is that they're powered by Scalable Vector Graphics (SVG). SVG is a perfect for creating rich and interactive visualizations in HTML5. Some benefits of charting with SVG include true client-side charting, DOM-friendly charts, hardware accelerated graphics, interactive animations and tooltips, and streaming visualizations. Plus, the charts require no additional plug-ins.
- Data Binding
C1BubbleChart supports binding data from an external data source on the server. Enabling DataBinding is as simple as setting the DataSourceID or DataSource and DataBindings properties. Our Chart supports all of the standard ASP.NET DataSource Controls such as SqlDataSource and all standard DataSource types such as DataTable. DataBinding in our charts is very familiar and can be done at design time or in code.
- Live Data
All ComponentOne charts are optimized for streaming live data. The charts will animate as the data changes and show transitions to visualize the data in the data set.
- AJAX Support
With client widget, user can get data by AJAX.
- Data Bind
User can create bubble chart from a data source.
- For more information see Binding C1BubbleChart to an AccessDataSource or the DataBind sample installed with ASP.NET Web Forms Edition.
- Adjust Axis
Automatically adjust the axis to make sure all the bubbles are inside of the chart area.
For more information see Step 3 of 5: Customizing the BubbleChart Appearance.
-
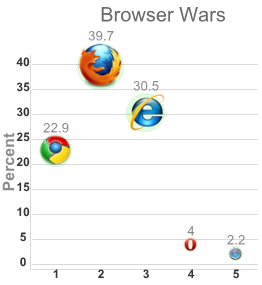
Custom Image Bubble
Rather than displaying a simple bubble you can create a custom image for each Bubble chart series. Custom images can be specified for the C1BubbleChartSeries using the Symbol property.
For more information see Bubble Appearance.
The following image displays custom images for each data point value.

-
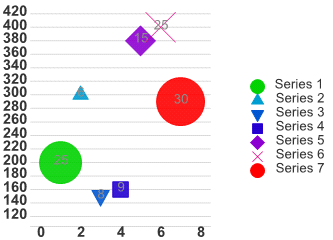
Bubble Shape
User can set the chart's bubble shape with Marker's sub property 'Type'.
For more information see Bubble Appearance.
The following chart illustrates the various shapes you can use on the C1BubbleChart series through the Type property:

-
Hide Bubble Series
End user can click the chart legend to show/hide the series bubbles.
For more information see Legend.

