Binding C1BubbleChart to an AccessDataSource
In This Topic
You can bind C1BubbleChart to a DataView by using the AccessDataSource to connect to the Microsoft Access DataBase file to the C1BubbleChart control and then using the Select command.
- Create a new Web Site.
- Copy the C1NWind.mdb database file from the App_Data folder from the ControlExplorer sample project to the App_Data folder in your project.
- Save and close the project then reopen it so you'll see that the C1Nwind.mdb file appears in your App_Data folder.
- Expand the Data node in the Visual Studio Toolbox and add the AccessDataSource component to your Web page using a drag-and-drop operation.
- Select Configure Data Source from AccessDataSource tasks menu.
- Click Browse to open the Select Microsoft Access Database dialog box and select the C1Nwind.mdb file to add it to the AccessSource1.DataFile property.
- Select Specify a custom SQL statement or stored procedure and enter the following in the SQL statement:
To write SQL statement in Microsoft Access Database dialog box
SelectCommand="select CategoryName, sum(ProductSales) as Sales, count(1) as CT from (SELECT DISTINCTROW
        Categories.CategoryName as CategoryName, Products.ProductName, Sum([Order Details Extended].ExtendedPrice) AS
        ProductSales
FROM Categories INNER JOIN (Products INNER JOIN (Orders INNER JOIN [Order Details Extended] ON Orders.OrderID =
        [Order Details Extended].OrderID) ON Products.ProductID = [Order Details Extended].ProductID) ON
        Categories.CategoryID = Products.CategoryID
WHERE (((Orders.OrderDate) Between #1/1/95# And #12/31/95#))
GROUP BY Categories.CategoryID, Categories.CategoryName, Products.ProductName
ORDER BY Products.ProductName) group by CategoryName;"
-
Click Next and then click Finish.
- Add C1BubbleChart to your page. For more information see Getting Started with ASP.NET Web Forms Edition.
- In design-view select the C1BubbleChart and click on its smart tag to open its task menu.
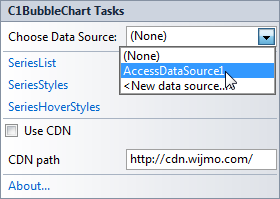
- Select AccessDataSource1 from the Choose Data Source dropdownlistbox.

- In the C1BubbleChart properties window click the ellipsis button next to DataBinding. The C1BubbleChartBinding Collection Editor appears.
- Click Add to add a C1BubbleChartBinding member.
- Enter the values for the following C1BubbleChartBinding properties:
- XField = CategoryName
- YField = Sales
- Y1Field = CT
- Expand the Axis->X->TextStyle node and set the Rotation property to -45.
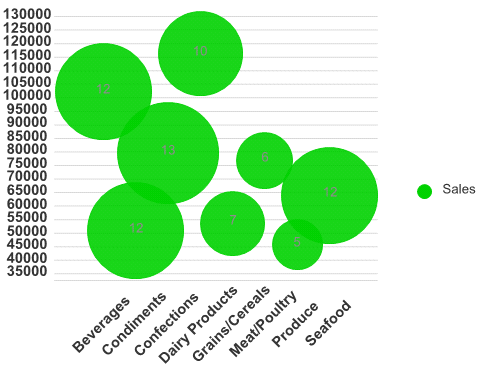
- Run and save your project. Observe the following at run-time:

See Also

