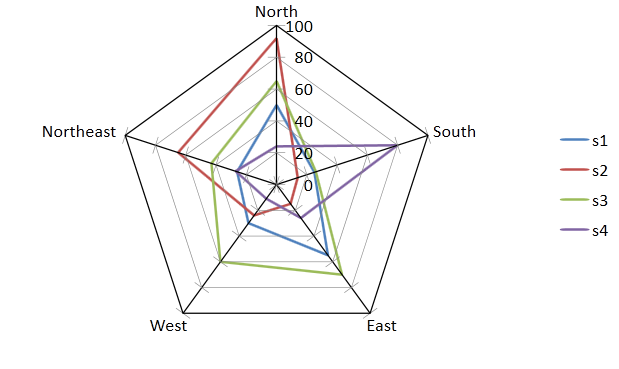
You can create different types of radar charts such as Radar, RadarFilled, and RadarWithMarkers. The following image displays a radar chart.
The following code creates a radar chart.
| CS |
Copy Code
|
|---|---|
object[,] values = { { "", "North", "South", "East", "West", "Northeast" }, { "s1", 50, 25, 55, 30, 26 }, { "s2", 92, 14, 15, 24, 65 }, { "s3", 65, 26, 70, 60, 43 }, { "s4", 24, 80, 26, 11, 27 } }; gcSpreadSheet1.Sheets[0].SetArray(0, 0, values); gcSpreadSheet1.Sheets[0].AddChart("chart1", GrapeCity.Windows.SpreadSheet.Data.SpreadChartType.Radar, "Sheet1!$A$1:$F$5", 0, 0, 500, 300); |
|
| VB.NET |
Copy Code
|
|---|---|
Dim values As Object(,) = {{"", "North", "South", "East", "West", "Northeast"}, {"s1", 50, 25, 55, 30, 26}, {"s2", 92, 14, 15, 24, 65}, {"s3", 65, 26, 70, 60, 43}, {"s4", 24, 80, 26, 11, 27}} GcSpreadSheet1.Sheets(0).SetArray(0, 0, values) GcSpreadSheet1.Sheets(0).AddChart("chart1", GrapeCity.Windows.SpreadSheet.Data.SpreadChartType.Radar, "Sheet1!$A$1:$F$5", 0, 0, 500, 300) |
|