To plot data in a simple chart, the properties DataX and DataY are set as follows:
For example, the chart below was created based on the NorthWind Products table. In this case, the following properties were set:
DataX = "ProductName"
DataY = "UnitPrice"
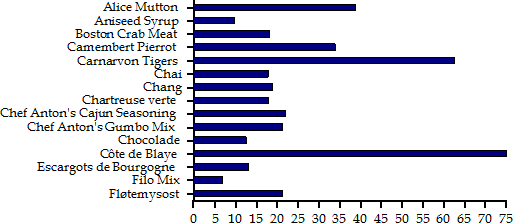
Note that for this chart type (Bar), the value axis (where the DataY field is displayed) is the horizontal one, and the category axis is the vertical one.
In this case, a filter was applied to the data in order to limit the number of values shown. Without the filter, the chart would contain too many values and the vertical axis would not be readable.
The DataY property is not restricted to field names. You can also plot series with calculated values. The strings that specify the series are actually treated as full expressions, and are calculated like any regular field in the report.
For example, to create a chart showing the actual price of each field you could set the DataY property to the value shown below:
DataY = "UnitPrice * (1 - Discount)"