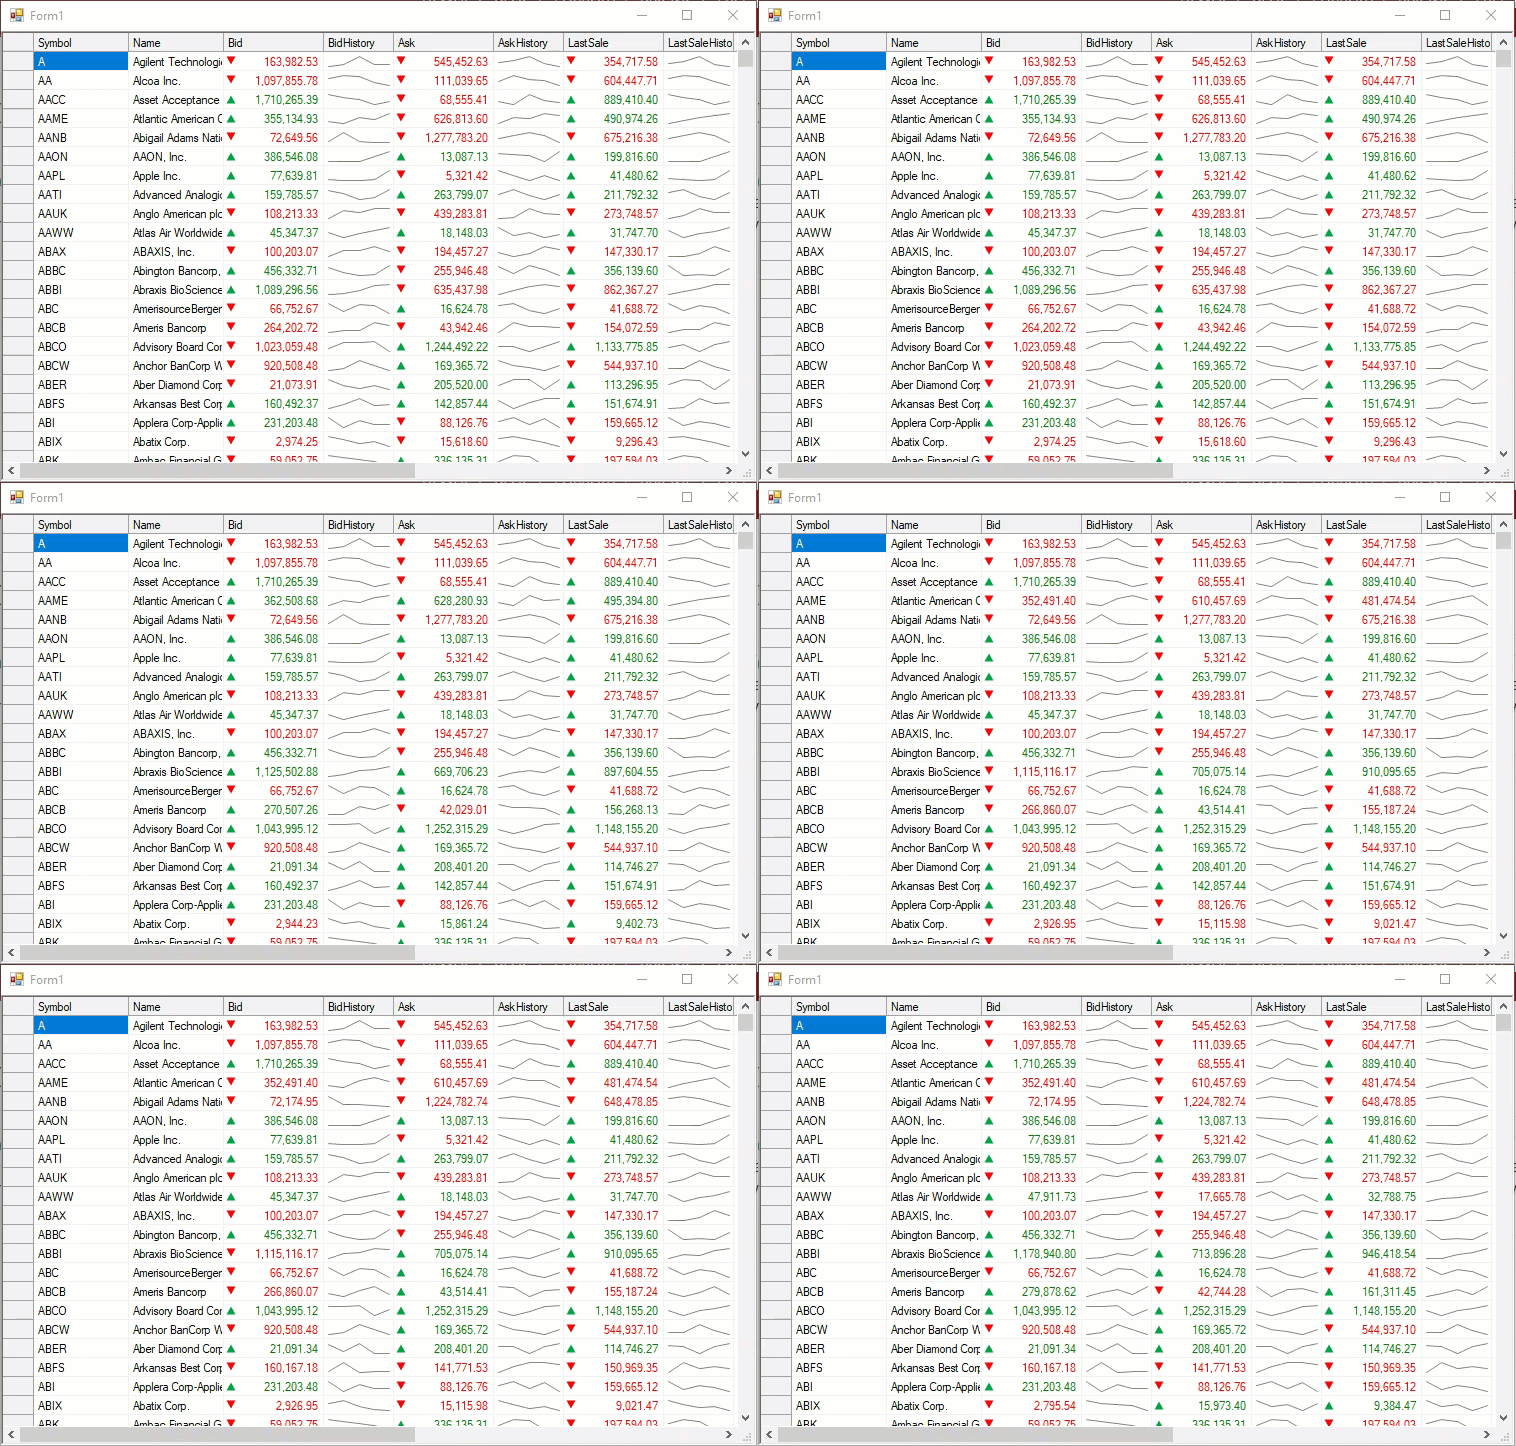
Show Live Data Updates
In today's fast moving world, showing live data updates is not just limited to stock market fluctuations, but could be used in variety of scenarios from sports scorecards to hospital dashboards to parking lots. This walkthrough takes you through the steps of creating a complete portal which displays live updates with frequent variations happening in the data source.

To create a portal displaying live data updates from the data source, your data source must be a BindingList<T> and the class representing your data item should have INotifyPropertyChanged implemented to notify change in data values. Then, bind the grid with your data source. Once bound grid recieves the notification of change in value, it can automatically update the values. As a last step which is optional, you may set some customizations to draw cells and arrows in different colors to indicate the increase or decrease in cell values. Let us go through the detailed steps to create a grid displaying real time data.

Set up the Application
Create a new Windows Forms app.
Drag and drop the FlexGrid control from the toolbox onto the form.
Observe: An empty grid is added to the form.
Bind the FlexGrid Control to a Data Source
To mimic the real time data, we have implemented a dummy data source in the form of BindingList which contains data items that notify the change in data values through INotifyPropertyChanged interface.
Create a class which implements INotifyPropertyChanged interface and represents the data item. In this case, we have created a class named FinancialData.
 Click for sample code of FinancialData class.
Create a BindingList containing the objects of class created above. Note that in this example, we have used a timer for changing values in order to simulate the real time data.
 Click for sample code of FinancialDataList class.
Bind the FlexGrid to this data source using DataSource property of the C1FlexGrid class.
//get the list of FinancialData
dataList = Financial.FinancialData.GetFinancialData();
dataList.BatchSize = 250;
c1FlexGrid1.DataSource = dataList;
'get the list of FinancialData dataList = FinancialData.GetFinancialData() dataList.BatchSize = 250 c1FlexGrid1.DataSource = dataList
Now, as the grid is bound and is recieving notifications about changes in data values, it is capable of updating the real time data automatically.
Customize the Cell Appearance
To further enhance usability of the live data changes, you may want to customize appearance of changing cells or show history of the changing values through sparkline columns. In this step, we are showing example of both of these customizations which are optional and can be done according to your requirement.
Create custom styles such as "Green" and "Red" in this case, to apply on increasing and decreasing cells of the grid columns. The style sets the forecolor to green and red to indicate the rising and declining change respectively.
//owner draw some cells to show price up/down graphically
c1FlexGrid1.DrawMode = C1.Win.C1FlexGrid.DrawModeEnum.OwnerDraw;
c1FlexGrid1.OwnerDrawCell += C1FlexGrid1_OwnerDrawCell;
// Add styles (Red, Green and Rating)
var style = c1FlexGrid1.Styles.Add("Red");
style.ImageAlign = ImageAlignEnum.LeftCenter;
style.ForeColor = Color.Red;
style = c1FlexGrid1.Styles.Add("Green");
style.ImageAlign = ImageAlignEnum.LeftCenter;
style.ForeColor = Color.Green;
'owner draw some cells to show price up/down graphically c1FlexGrid1.DrawMode = DrawModeEnum.OwnerDraw AddHandler c1FlexGrid1.OwnerDrawCell, AddressOf C1FlexGrid1_OwnerDrawCell ' Add styles (Red, Green and Rating) Dim style = c1FlexGrid1.Styles.Add("Red") style.ImageAlign = ImageAlignEnum.LeftCenter style.ForeColor = Color.Red style = c1FlexGrid1.Styles.Add("Green") style.ImageAlign = ImageAlignEnum.LeftCenter style.ForeColor = Color.GreenSet the DrawMode property to OwnerDraw and use the OwnerDrawCell event to apply the custom styles and show up or down arrow images in the grid cells.
private void C1FlexGrid1_OwnerDrawCell(object sender, C1.Win.C1FlexGrid.OwnerDrawCellEventArgs e)
{
//check if the cell is valid and needs to be owner drawn
    if (IsCustomCol(e.Col) && (e.Row >= c1FlexGrid1.Rows.Fixed && e.Col >= c1FlexGrid1.Cols.Fixed)) {
    var data = c1FlexGrid1.Rows[e.Row].DataSource as FinancialData;
    if (data is null) return;
    var list = data.GetHistory(c1FlexGrid1.Cols[e.Col].Name);
    double oldValue = 0;
    if (list != null && list.Count > 1)
    {
        oldValue = (double)list[list.Count - 2];
    }
    var val = Convert.ToDouble(c1FlexGrid1.GetData(e.Row, e.Col));
    // calculate percentage change
        var change = oldValue == 0 || double.IsNaN(oldValue) ? 0 : ( val - oldValue) / oldValue;
    if (change == 0) {
        e.Image = null;
    }
    else if (change < 0)
    {
        e.Style = c1FlexGrid1.Styles["Red"];
        e.Image = Properties.Resources.DownRed;
    }
    else
    {
        e.Style = c1FlexGrid1.Styles["Green"];
        e.Image = Properties.Resources.UpGreen;
    }
}
}
Private Sub C1FlexGrid1_OwnerDrawCell(ByVal sender As Object, ByVal e As OwnerDrawCellEventArgs) 'check if the cell is valid and needs to be owner drawn If IsCustomCol(e.Col) AndAlso e.Row >= c1FlexGrid1.Rows.Fixed AndAlso e.Col >= c1FlexGrid1.Cols.Fixed Then Dim data = TryCast(c1FlexGrid1.Rows(e.Row).DataSource, FinancialData) If data Is Nothing Then Return Dim list = data.GetHistory(c1FlexGrid1.Cols(e.Col).Name) Dim oldValue As Double = 0 If list IsNot Nothing AndAlso list.Count > 1 Then oldValue = list(list.Count - 2) End If Dim val = Convert.ToDouble(c1FlexGrid1.GetData(e.Row, e.Col)) ' calculate percentage change Dim change = If(oldValue = 0 OrElse Double.IsNaN(oldValue), 0, (val - oldValue) / oldValue) If change = 0 Then e.Image = Nothing ElseIf change < 0 Then e.Style = c1FlexGrid1.Styles("Red") e.Image = Resources.DownRed Else e.Style = c1FlexGrid1.Styles("Green") e.Image = Resources.UpGreen End If End If End SubCreate sparkline columns to display history of changing cell values in columns such as "BidHistory" for "Bid" column, "AskHistory" for "Ask" column and so on.
//customize columns format and width
c1FlexGrid1.Cols["Bid"].Format = "N2";
c1FlexGrid1.Cols["Bid"].Width = 100;
//add Sparkline cols to show history
var bidSparkCol = c1FlexGrid1.Cols.Insert(c1FlexGrid1.Cols["Bid"].Index + 1);
//same name as the corresponding history property of the FinancialData
bidSparkCol.Name = bidSparkCol.Caption = "BidHistory";
bidSparkCol.ShowSparkline = true;
bidSparkCol.Width = 70;
bidSparkCol.Sparkline.SparklineType = SparklineType.Line;
bidSparkCol.Sparkline.Styles.SeriesColor = Color.Gray;
'customize columns format and width c1FlexGrid1.Cols("Bid").Format = "N2" c1FlexGrid1.Cols("Bid").Width = 100 'add Sparkline cols to show history Dim bidSparkCol = c1FlexGrid1.Cols.Insert(c1FlexGrid1.Cols("Bid").Index + 1) 'same name as the corresponding history property of the FinancialData bidSparkCol.Name = "BidHistory" bidSparkCol.Caption = "BidHistory" bidSparkCol.ShowSparkline = True bidSparkCol.Width = 70 bidSparkCol.Sparkline.SparklineType = SparklineType.Line bidSparkCol.Sparkline.Styles.SeriesColor = Color.Gray


