- 3D Chart for WinForms Overview
- Key Features
- 3D Chart Design-Time Support
- 3D Chart Fundamentals
- 3D Axes
- Design-Time Tools for Creating 3D Charts
- 3D Data
- 3D Labels
- 3D Chart Elements
- 3D Contour Styles
- 3D Chart End-User Interaction
- Chart 3D for WinForms Samples
- Chart 3D for WinForms Task-Based Help
- Chart 3D for WinForms Frequently Asked Questions
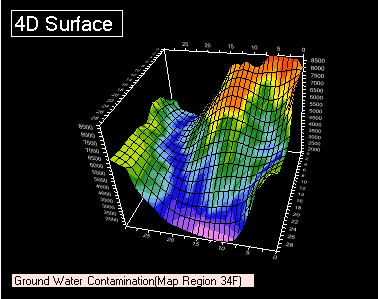
Displaying 4D Data
3D Chart enables developers to represent four-dimensional plots and Bar charts using color as the fourth dimension.
A 4D chart uses color to display a fourth dimension of data on a 3D Surface or Bar chart. The colors come from a second set of data that the chart uses for the zoning and contouring colors. 4D charts are useful for visualizing two sets of identically sized data in one chart.