- 3D Chart for WinForms Overview
- Key Features
- 3D Chart Design-Time Support
- 3D Chart Fundamentals
- 3D Axes
- Design-Time Tools for Creating 3D Charts
- 3D Data
- 3D Labels
- 3D Chart Elements
- 3D Contour Styles
- 3D Chart End-User Interaction
- Chart 3D for WinForms Samples
- Chart 3D for WinForms Task-Based Help
- Chart 3D for WinForms Frequently Asked Questions
Data Binding
Data binding in C1Chart3D is a technique that connects data sources with 3D visual components, enabling dynamic visualizations. C1Chart3D allows you to bind data at run-time in three ways namely, Regular Grid DataSet, Irregular Grid DataSet, and Point DataSet.
Regular Grid DataSet
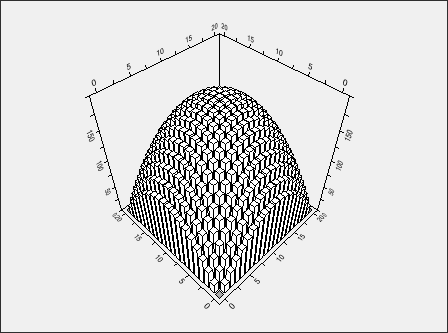
Regular Grid layouts are used when the X-coordinates and Y-coordinates of each point maintain consistent distances apart. To bind C1Chart3D with a Regular DataSet, create a Chart3DDataSetGrid object and assign it to C1Chart3D. The below image illustrates chart with Regular Grid DataSet.

The following code illustrates use of regular grid data set with Chart3d.
//Setting Regular Grid Data
int i, j;
double[,] z = new double[21, 21];
for (i = 0; i < z.GetLength(0); i++)
{
    for (j = 0; j < z.GetLength(1); j++)
    {
        z[i, j] = 200 - ((i - 10) * (i - 10) + (j - 10) * (j - 10));
    }
}
Chart3DDataSetGrid gridset = new Chart3DDataSetGrid(0, 0, 1, 1, z);
c1Chart3D1.ChartGroups[0].ChartData.SetGrid = gridset;
Irregular Grid DataSet
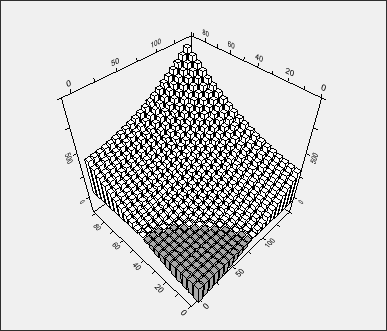
Irregular Grid layouts are used when the X-coordinates or Y-coordinates of each point are not equidistant. To bind C1Chart3D with an Irregular DataSet, create a Chart3DDataSetIrGrid object and assign it to C1Chart3D. The below image illustrates chart with Irregular Grid DataSet.

The following code illustrates use of irregular grid data set with Chart3d.
//Setting Irregular Grid Data
int i, j;
double[] x = new double[21];
double[] y = new double[21]; ;
double[,] z = new double[21, 21];
for (i = 0; i < 21; i++)
{
    x[i] = i * 07.122;
    y[i] = i * 04.562;
}
for (i = 0; i < 21; i++)
{
    for (j = 0; j < 21; j++)
    {
        z[i, j] = ((i - 10.2) * (i + 17.2) + (j + 10.2) * (j - 1.2));
    }
}
Chart3DDataSetIrGrid irrgrieset = new Chart3DDataSetIrGrid(x, y, z);
c1Chart3D1.ChartGroups[0].ChartData.SetIrGrid = irrgrieset;
Point DataSet
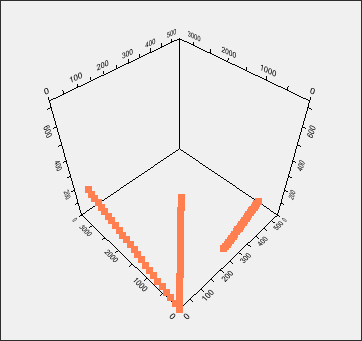
The Point Data Layout is used exclusively for scatter plots when charting multiple series of points. The below image illustrates chart with Point DataSet.

The following code illustrates use of point data set with Chart3d.
//Setting Point data
Chart3DDataSetPoint setPoint = new Chart3DDataSetPoint();
Chart3DPoint[] pointArr = new Chart3DPoint[100];
Chart3DPoint point;
for (int i = 0; i < 50; i++)
{
    if (i % 2 == 0)
    {
        point = new Chart3DPoint(i * 1.1, i * 72, i * 3);
        pointArr[i] = point;
    }
    else
    {
        point = new Chart3DPoint(i * 0.1, i * 0.3, i * 7.4);
        pointArr[i] = point;
    }
}
for (int i = 50; i < 100; i++)
{
    if (i % 2 == 0)
    {
        point = new Chart3DPoint(i * 5.5, i * 6.1, i * 0.003);
        pointArr[i] = point;
    }
    else
    {
        point = new Chart3DPoint(i * 0.1, i * 0.3, i * 7.4);
        pointArr[i] = point;
    }
}
setPoint.AddSeries(pointArr);
c1Chart3D1.ChartGroups[0].ChartData.SetPoint = setPoint;
c1Chart3D1.ChartGroups[0].ChartType = Chart3DTypeEnum.Scatter;


