To style the lines in the LineChartSeries, complete the following:
1. Select View | Properties Window in the Visual Studio menu.
2. Click the drop-down list at the top of the Properties window and select Panel1_C1LineChartExtender.
3. Locate the SeriesStyles and click on the ellipsis button next to the SeriesStyles property.
The ChartStyle Collection Editor appears.
4. Click the Add button once to add one new member.
5. Set the Stroke to “#00a6dd”, StrokeWidth to “5”, and Opacity to “0.8”
6. Click OK to save and close the ChartStyle Collection Editor.
Styling the Line in the LineChartSeries in Source View:
To style the line in the LineChartSeries, click the source tab and add the following code in your source file:
<cc1:C1LineChartExtender ID="Panel1_C1LineChartExtender" runat="server"
Height="300" TargetControlID="Panel1" Width="400">
<SeriesTransition Duration="2000">
</SeriesTransition>
<Animation Duration="2000">
</Animation>
<SeriesList>
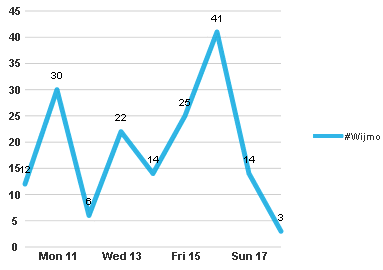
<cc1:LineChartSeries Label="#Wijmo" LegendEntry="True">
<Data>
<X>
<Values>
<cc1:ChartXData DateTimeValue="2011-04-10" />
<cc1:ChartXData DateTimeValue="2011-04-11" />
<cc1:ChartXData DateTimeValue="2011-04-12" />
<cc1:ChartXData DateTimeValue="2011-04-13" />
<cc1:ChartXData DateTimeValue="2011-04-14" />
<cc1:ChartXData DateTimeValue="2011-04-15" />
<cc1:ChartXData DateTimeValue="2011-04-16" />
<cc1:ChartXData DateTimeValue="2011-04-17" />
<cc1:ChartXData DateTimeValue="2011-04-18" />
</Values>
</X>
<Y>
<Values>
<cc1:ChartYData DoubleValue="12" />
<cc1:ChartYData DoubleValue="30" />
<cc1:ChartYData DoubleValue="6" />
<cc1:ChartYData DoubleValue="22" />
<cc1:ChartYData DoubleValue="14" />
<cc1:ChartYData DoubleValue="25" />
<cc1:ChartYData DoubleValue="41" />
<cc1:ChartYData DoubleValue="14" />
<cc1:ChartYData DoubleValue="3" />
</Values>
</Y>
</Data>
</cc1:LineChartSeries>
</SeriesList>
<SeriesStyles>
<cc1:ChartStyle Opacity="0.8" Stroke="#00A6DD" StrokeWidth="5">
</cc1:ChartStyle>
</SeriesStyles>
<Footer Compass="South" Visible="False">
</Footer>
<Legend>
<Size Height="3" Width="30">
</Size>
</Legend>
<Axis>
<Y Compass="West" Visible="False">
<Labels TextAlign="Center">
</Labels>
<GridMajor Visible="True">
</GridMajor>
</Y>
</Axis>
</cc1:C1LineChartExtender>
This topic illustrates the following:
When you run your project the LineChart will appear like the following: