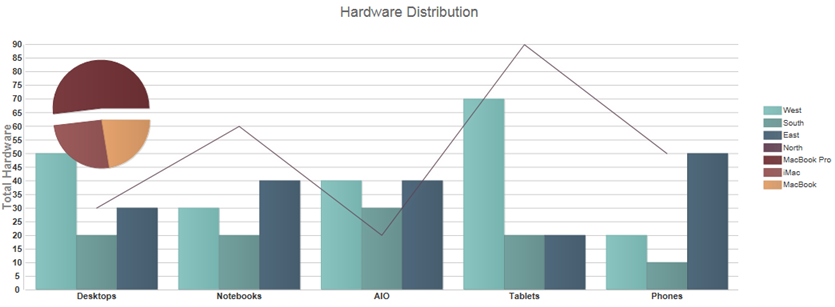
Press F5 to run the project and view the composite chart. Notice there are three types of charts on one page.