ComponentOne Extender Controls for ASP.NET Web Forms
Wijmo Control Toolkit Extender Controls / Chart Extenders / C1LineChartExtender / Adding Data to the Line Chart
In This Topic
    Adding Data to the Line Chart
    In This Topic

    Data can be added to the Line chart by defining a series. Once you add a series you can add the ChartXData and ChartYData. The following values can be added to the ChartXData or ChartYData: DateTimeValue, DoubleValue, and StringValue. In this example you will use string values for the ChartXData and double values for ChartYData.

    To add data to the bar chart using the BarChartSeries Collection, complete the following:

    1. In your Web application, add a reference to the C1.Web.Wijmo.Extenders.3.dll and then add a standard Panel control to the main content of  your page.
    2. Click the Panel smart tag and select Add Extender from the Panel Tasks menu.
    3. In the Extender Wizard, select C1LineChartExtender and click OK. A C1LineChartExtender control is added to the page and the TargetControlID is set to Panel1.


            <cc1:C1LineChartExtender ID="Panel1_C1LineChartExtender" runat="server"           

              TargetControlID="Panel1">

                <SeriesTransition Duration="2000">

                </SeriesTransition>

                <Animation Duration="2000">

                </Animation>

                <Footer Compass="South" Visible="False">

                </Footer>

                <Legend>

                    <Size Height="3" Width="30">

                    </Size>

                </Legend>

                <Axis>

                    <Y Compass="West" Visible="False">

                        <Labels TextAlign="Center">

                        </Labels>

                        <GridMajor Visible="True">

                        </GridMajor>

                    </Y>

                </Axis>

            </cc1:C1LineChartExtender>

    1. Select View | Properties Window in the Visual Studio menu.
    2. Click the drop-down list at the top of the Properties window and select Panel1_C1LineChartExtender.
    3. Locate the SeriesList and click on the ellipsis button next to the SeriesList item.

    The LineChartSeries Collection Editor appears.

    1. In the LineChartSeries Collection Editor, click the Add buton to add a new LineChartSeries to the LineChart.
    2. Set the Label property to #Wijmo for the LineChartSeries.
    3. Select Data -> X from the properties pane in the LineChartSeries Collection Editor and click the ellipsis button next to the Values property to open the ChartXData Collection Editor.
    4. Click Add nine times to add nine members and enter the following values next to to the DateTimeValue property for each member:  “2011-04-10”, “2011-04-11”, “2011-04-12”, “2011-04-13”, “2011-04-14”, “2011-04-15”, “2011-04-16”, “2011-04-17”, and “2011-04-18”.
    5. Click OK to save and close the ChartXData Collection Editor.
    6. Select Data -> Y from the properties pane in the LineChartSeries Collection Editor and and click the ellipsis button next to the Values property to open the ChartYData Collection Editor.
    7. Click Add nine times to add nine members and enter the following data next to the DoubleValue property: 12, 30, 6, 22, 14, 25, 41, 14, and 3.14.    Click OK to save and close the ChartYData Collection Editor.

    Adding Data to the Line Chart in Source View:

    To add data to the LineChart, click the source tab and add the following code in your source file:

    <cc1:C1LineChartExtender ID="Panel1_C1LineChartExtender" runat="server"

                Height="300" TargetControlID="Panel1" Width="400">          

    <SeriesTransition Duration="2000">

                </SeriesTransition>

                <Animation Duration="2000">

                </Animation>

                <SeriesList>

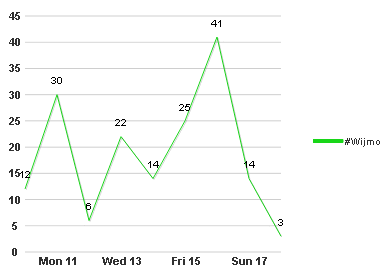
                    <cc1:LineChartSeries Label="#Wijmo" LegendEntry="True">

                        <Data>

                            <X>

                                <Values>

                                    <cc1:ChartXData DateTimeValue="2011-04-10" />

                                    <cc1:ChartXData DateTimeValue="2011-04-11" />

                                    <cc1:ChartXData DateTimeValue="2011-04-12" />

                                    <cc1:ChartXData DateTimeValue="2011-04-13" />

                                    <cc1:ChartXData DateTimeValue="2011-04-14" />

                                    <cc1:ChartXData DateTimeValue="2011-04-15" />

                                    <cc1:ChartXData DateTimeValue="2011-04-16" />

                                    <cc1:ChartXData DateTimeValue="2011-04-17" />

                                    <cc1:ChartXData DateTimeValue="2011-04-18" />

                                </Values>

                            </X>

                            <Y>

                                <Values>

                                    <cc1:ChartYData DoubleValue="12" />

                                    <cc1:ChartYData DoubleValue="30" />

                                    <cc1:ChartYData DoubleValue="6" />

                                    <cc1:ChartYData DoubleValue="22" />

                                    <cc1:ChartYData DoubleValue="14" />

                                    <cc1:ChartYData DoubleValue="25" />

                                    <cc1:ChartYData DoubleValue="41" />

                                    <cc1:ChartYData DoubleValue="14" />

                                    <cc1:ChartYData DoubleValue="3" />

                                </Values>

                            </Y>

                        </Data>

                    </cc1:LineChartSeries>

                </SeriesList>

                <Footer Compass="South" Visible="False">

                </Footer>

                <Legend>

                    <Size Height="3" Width="30">

                    </Size>

                </Legend>

                <Axis>

                    <Y Compass="West" Visible="False">

                        <Labels TextAlign="Center">

                        </Labels>

                        <GridMajor Visible="True">

                        </GridMajor>

                    </Y>

                </Axis>

            </cc1:C1LineChartExtender>

    This topic illustrates the following: