ComponentOne Extender Controls for ASP.NET Web Forms
Wijmo Control Toolkit Extender Controls / Chart Extenders / C1CompositeChartExtender / Creating a Scatter Plot Type in the CompositeChart
In This Topic
    Creating a Scatter Plot Type in the CompositeChart
    In This Topic

    To create a Scatter plot type in the composite chart, complete the following:

    1. In your Web application, add a reference to the C1.Web.Wijmo.Extenders.3.dll and then add a standard Panel control to the main content of  your page.
    2. Click the Panel smart tag and select Add Extender from the Panel Tasks menu.
    3. In the Extender Wizard, select C1CompositeChartExtender and click OK. A CompositeChartExtender control is added to the page and the TargetControlID is set to Panel1.
    4. Select View | Properties Window in the Visual Studio menu.
    5. Click the drop-down list at the top of the Properties window and select Panel1_C1CompositeChartExtender.
    6. Select the ellipsis button next to the SeriesList property. The CompositeChartSeries Collection Editor dialog box opens.
    7. Click Add two times to add two new members.
    8. Expand the Data node for the first two members and enter the following values:


    Member Property Value
    0

    ChartXData.DoubleValues

    ChartYData.DoubleValues

    Label

    Type

    0, 1, 2, 3, 4, 5

    1, 1.5, 2.8, 3.5, 3.9, 4.2

    Observations

    Scatter

    1

    ChartXData.DoubleValues

    ChartYData.DoubleValues

    Label

    Type

    0, 5

    1.11, 4.51

    Regression Line

    Line

    1. Click OK to save and close the CompositeChartSeries Collection Editor.
    2. Expand the Axis->X and set the Max property to 6 and the Min property to -5.
    3. Run the project to see the multiple chart types on the composite chart.

    Adding Data to the Composite Chart in Source View:

    To add data to a Scatter chart and Line chart in the Composite chart, click the source tab and add the following code in your source file:

    <cc1:C1CompositeChartExtender ID="Panel1_C1CompositeChartExtender"

                runat="server" Height="300" TargetControlID="Panel1" Width="450">

                <SeriesList>

                    <cc1:CompositeChartSeries Label="Observations" LegendEntry="True"

                        Type="Scatter">

                        <Data>

                            <X>

                                <Values>

                                    <cc1:ChartXData DoubleValue="0" />

                                    <cc1:ChartXData DoubleValue="1" />

                                    <cc1:ChartXData DoubleValue="2" />

                                    <cc1:ChartXData DoubleValue="3" />

                                    <cc1:ChartXData DoubleValue="4" />

                                    <cc1:ChartXData DoubleValue="5" />

                                </Values>

                            </X>

                            <Y>

                                <Values>

                                    <cc1:ChartYData DoubleValue="1" />

                                    <cc1:ChartYData DoubleValue="1.5" />

                                    <cc1:ChartYData DoubleValue="2.8" />

                                    <cc1:ChartYData DoubleValue="3.5" />

                                    <cc1:ChartYData DoubleValue="3.9" />

                                    <cc1:ChartYData DoubleValue="4.2" />

                                </Values>

                            </Y>

                        </Data>

                    </cc1:CompositeChartSeries>

                    <cc1:CompositeChartSeries Label="South" LegendEntry="True" Type="Line">

                        <Data>

                            <X>

                                <Values>

                                    <cc1:ChartXData DoubleValue="0" />

                                    <cc1:ChartXData DoubleValue="5" />

                                </Values>

                            </X>

                            <Y>

                                <Values>

                                    <cc1:ChartYData DoubleValue="1.11" />

                                    <cc1:ChartYData DoubleValue="4.51" />

                                </Values>

                            </Y>

                        </Data>

                    </cc1:CompositeChartSeries>

                </SeriesList>

                <Footer Compass="South" Visible="False">

                </Footer>

                <Axis>

                    <X Max="6" Min="-5">

                    </X>

                    <Y Compass="West" Visible="False">

                        <Labels TextAlign="Center">

                        </Labels>

                        <GridMajor Visible="True">

                        </GridMajor>

                    </Y>

                </Axis>

            </cc1:C1CompositeChartExtender>

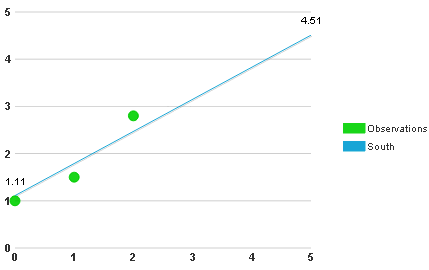
    This Topic Illustrates the Following:

    The following image shows a C1CompositeChart with two chart types added, Scatter and Line: