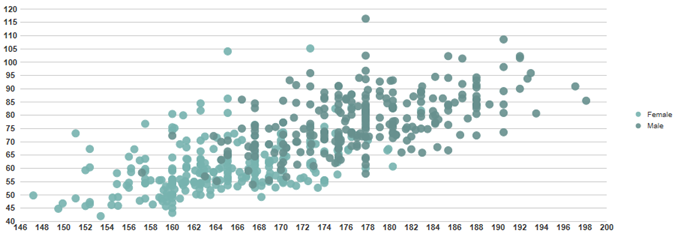
The C1ScatterChartExtender control allows the user to show customized scatter charts that use two values to represent each data point. Scatter charts are useful in depicting relationships between two dimensions of the data, and are often used in statistical analysis of data.
C1ScatterChartExtender Markup
The following markup creates a C1ScatterChartExtender control. Set the TargetControlID property to attach the extender to a control.
<cc1:C1ScatterChartExtender ID="Panel4_C1ScatterChartExtender" runat="server"
TargetControlID="Panel4">
<SeriesTransition Duration="2000">
</SeriesTransition>
<Animation Duration="2000">
</Animation>
<Footer Compass="South" Visible="False">
</Footer>
<Legend>
<Size Height="3" Width="30">
</Size>
</Legend>
<Axis>
<Y Compass="West" Visible="False">
<Labels TextAlign="Center">
</Labels>
<GridMajor Visible="True">
</GridMajor>
</Y>
</Axis>
</cc1:C1ScatterChartExtender>