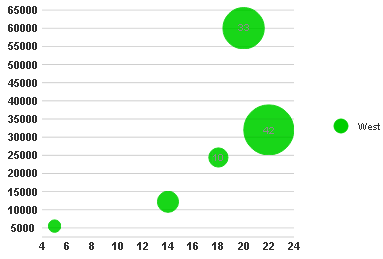
You can use the BubbleChartSeries.InvisibleMarkLabels property to hide the automatic chart labels that appear inside the data marker (bubble). To hide the first and fourth data maker labels, complete the following:
Select View | Properties Window in the Visual Studio menu.
The BubbleChartSeries Collection Editor appears.
The Int32 Collection Editor appears.
Specifying Invisible Mark Labels in Source View
To hide the automatic chart labels that appear inside the data marker (bubble) use the BubbleChartSeries.InvisibleMarkLabels like the following:
<cc1:C1BubbleChartExtender ID="Panel1_C1BubbleChartExtender" runat="server"
Height="300" TargetControlID="Panel1" Width="400">
<Animation Duration="500" Easing="EaseOutElastic">
</Animation>
<SeriesList>
<cc1:BubbleChartSeries Label="West" LegendEntry="True"
InvisibleMarkLabels="1, 4">
<Data>
<Y1 DoubleValues="3, 12, 33, 10, 42" />
<X>
<Values>
<cc1:ChartXData DoubleValue="5" />
<cc1:ChartXData DoubleValue="14" />
<cc1:ChartXData DoubleValue="20" />
<cc1:ChartXData DoubleValue="18" />
<cc1:ChartXData DoubleValue="22" />
</Values>
</X>
<Y>
<Values>
<cc1:ChartYData DoubleValue="5500" />
<cc1:ChartYData DoubleValue="12200" />
<cc1:ChartYData DoubleValue="60000" />
<cc1:ChartYData DoubleValue="24400" />
<cc1:ChartYData DoubleValue="32000" />
</Values>
</Y>
</Data>
<Markers Type="Circle">
</Markers>
</cc1:BubbleChartSeries>
</SeriesList>
<Footer Compass="South" Visible="False">
</Footer>
<Axis>
<Y Compass="West" Visible="False">
<Labels TextAlign="Center">
</Labels>
<GridMajor Visible="True">
</GridMajor>
</Y>
</Axis>
</cc1:C1BubbleChartExtender>