To create negative X and Y values for the BubbleChartSeries, set the X and Y Origin to zero so that it displays the negative values on the left side of the axis and only the postive values on the right side of the axis.
This topic illustrates how to display negative X and Y BubbleChartSeries values on the C1BubbleChart in Design View and Source View.
Creating Negative X and Y values for your C1BubbleChart in Design Veiw:
| Member | Label | ChartXData | ChartYData | Y1Data |
|---|---|---|---|---|
| 0 | West | -5, 14, 20, 18, 22 | -5500 | 3, 12, 33, 10, 42 |
Creating Negative X and Y values in Source View:
To create negative X and Y values for your C1BubbleChart, click the source tab and add the following code in your source file:
<cc1:C1BubbleChartExtender ID="Panel1_C1BubbleChartExtender" runat="server"
TargetControlID="Panel1">
<Animation Duration="500" Easing="EaseOutElastic">
</Animation>
<SeriesList>
<cc1:BubbleChartSeries Label="West" LegendEntry="True">
<Data>
<Y1 DoubleValues="3, 12, 33, 10, 42" />
<X>
<Values>
<cc1:ChartXData DoubleValue="-5" />
<cc1:ChartXData DoubleValue="14" />
<cc1:ChartXData DoubleValue="20" />
<cc1:ChartXData DoubleValue="18" />
<cc1:ChartXData DoubleValue="22" />
</Values>
</X>
<Y>
<Values>
<cc1:ChartYData DoubleValue="-5500" />
<cc1:ChartYData DoubleValue="12200" />
<cc1:ChartYData DoubleValue="60000" />
<cc1:ChartYData DoubleValue="24400" />
<cc1:ChartYData DoubleValue="32000" />
</Values>
</Y>
</Data>
</cc1:BubbleChartSeries>
</SeriesList>
<Footer Compass="South" Visible="False">
</Footer>
<Axis>
<X Origin="0">
</X>
<Y Compass="West" Visible="False">
<Labels TextAlign="Center">
</Labels>
<GridMajor Visible="True">
</GridMajor>
</Y>
</Axis>
</cc1:C1BubbleChartExtender>
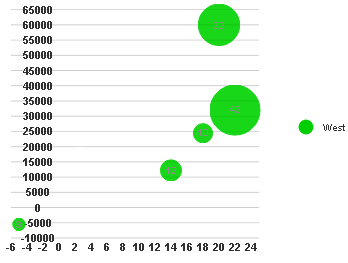
This Topic Illustrates the Following:The following image shows a C1BubbleChart with negative X and Y values: