ComponentOne Extender Controls for ASP.NET Web Forms
Wijmo Control Toolkit Extender Controls / Chart Extenders / C1BubbleChart Extender / Creating Diamond Markers
In This Topic
    Creating Diamond Markers
    In This Topic

    To create diamond markers instead of bubbles, use the SeriesList’s Markers property to define the type of marker used. You can choose from Circle, Tri, InvertedTri, Box, Diamond or Cross.

    This topic illustrates how to change marker type in Design view and in Source view.

    Changing the Marker Type in Design View:

    To change the marker type of your C1BubbleChart, follow these steps:

    1. Select View | Properties Window in the Visual Studio menu.
    2. Click the drop-down list at the top of the Properties window and select Panel1_C1BubbleChartExtender.
    3. Click the ellipsis button next to the SeriesList property. The BubbleChartSeries Collection Editor appears.
    4. Select the series from the Members list that you wish to change its marker type. In this example we’ll select the first series from the Members list.
    5. Select the dropdown arrow next to the Type and then choose Diamond.
    6. Cick OK.

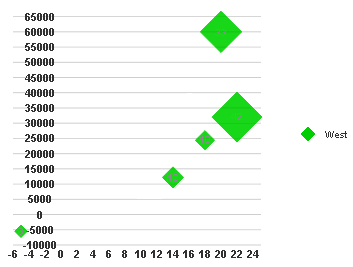
    The Diamond marker type is applied to the first bubble chart series.

    Changing the Marker Type in Source View

    To change the marker type for the first series in Source view, add <Markers Type="Diamond"></Markers> tag so that the tag resembles the following:

    <cc1:C1BubbleChartExtender ID="Panel1_C1BubbleChartExtender" runat="server"

                Height="300" TargetControlID="Panel1" Width="400">

                <Animation Duration="500" Easing="EaseOutElastic">

                </Animation>

                <SeriesList>

                    <cc1:BubbleChartSeries Label="West" LegendEntry="True">

                        <Data>

                            <Y1 DoubleValues="3, 12, 33, 10, 42" />

                            <X>

                                <Values>

                                    <cc1:ChartXData DoubleValue="-5" />

                                    <cc1:ChartXData DoubleValue="14" />

                                    <cc1:ChartXData DoubleValue="20" />

                                    <cc1:ChartXData DoubleValue="18" />

                                    <cc1:ChartXData DoubleValue="22" />

                                </Values>

                            </X>

                            <Y>

                                <Values>

                                    <cc1:ChartYData DoubleValue="-5500" />

                                    <cc1:ChartYData DoubleValue="12200" />

                                    <cc1:ChartYData DoubleValue="60000" />

                                    <cc1:ChartYData DoubleValue="24400" />

                                    <cc1:ChartYData DoubleValue="32000" />

                                </Values>

                            </Y>

                        </Data>

                        <Markers Type="Diamond">

                        </Markers>

                    </cc1:BubbleChartSeries>

                </SeriesList>

                <Footer Compass="South" Visible="False">

                </Footer>

                <Axis>

                    <X Origin="0">

                    </X>

                    <Y Compass="West" Visible="False">

                        <Labels TextAlign="Center">

                        </Labels>

                        <GridMajor Visible="True">

                        </GridMajor>

                    </Y>

                </Axis>

            </cc1:C1BubbleChartExtender>

    This Topic Illustrates the Following:

    The following image shows a C1BubbleChart with the first BubbleChartSeries having a diamond marker type: