Data can be added to the Composite chart by defining a series. Once you add a series you can add the ChartXData and ChartYData. The following values can be added to the ChartXData or ChartYData: DateTimeValue, DoubleValue, and StringValue.
To add data to the bar chart using the CompositeChartSeries Collection, complete the following:
<cc1:C1CompositeChartExtender ID="Panel1_C1CompositeChartExtender"
runat="server" TargetControlID="Panel1">
<Footer Compass="South" Visible="False">
</Footer>
<Axis>
<Y Compass="West" Visible="False">
<Labels TextAlign="Center">
</Labels>
<GridMajor Visible="True">
</GridMajor>
</Y>
</Axis>
</cc1:C1CompositeChartExtender>
| Member | Property | Value |
|---|---|---|
| 0 |
Data.X.StringValues Data.Y.DoubleValues Label |
Desktops,Notebooks,AIO,Tablets,Phones 50, 30, 40, 70, 20 West |
| 1 |
Data.X.StringValues Data.Y.DoubleValues Label |
Desktops,Notebooks,AIO,Tablets,Phones 20, 20, 30, 20, 10 South |
| 2 |
Data.X.StringValues Data.Y.DoubleValues Label |
Desktops,Notebooks,AIO,Tablets,Phones 30, 40, 40, 20, 50 East |
| 3 |
Data.X.StringValues Data.Y.DoubleValues Label |
Desktops,Notebooks,AIO,Tablets,Phones 30, 60, 20, 90, 50 North |
Enter the following values for each property:
Member Data Property Label Property Offset Property 0 46.78 MacBook Pro 15 1 23.18 iMac 0 2 20.25 MacBook 0
Adding Data to the Composite Chart in Source View:
To add data to a Bar chart and Pie chart in the Composite chart, click the source tab and add the following code in your source file:
<cc1:C1CompositeChartExtender ID="Panel1_C1CompositeChartExtender"
runat="server" Height="300" TargetControlID="Panel1" Width="450">
<SeriesList>
<cc1:CompositeChartSeries Label="West" LegendEntry="True" Type="Column">
<Data>
<X>
<Values>
<cc1:ChartXData StringValue="Desktops" />
<cc1:ChartXData StringValue="Notebooks" />
<cc1:ChartXData StringValue="AIO" />
<cc1:ChartXData StringValue="Tablets" />
<cc1:ChartXData StringValue="Phones" />
</Values>
</X>
<Y>
<Values>
<cc1:ChartYData DoubleValue="50" />
<cc1:ChartYData DoubleValue="30" />
<cc1:ChartYData DoubleValue="40" />
<cc1:ChartYData DoubleValue="70" />
<cc1:ChartYData DoubleValue="20" />
</Values>
</Y>
</Data>
</cc1:CompositeChartSeries>
<cc1:CompositeChartSeries Label="South" LegendEntry="True" Type="Column">
<Data>
<X>
<Values>
<cc1:ChartXData StringValue="Desktops" />
<cc1:ChartXData StringValue="Notebooks" />
<cc1:ChartXData StringValue="AIO" />
<cc1:ChartXData StringValue="Tablets" />
<cc1:ChartXData StringValue="Phones" />
</Values>
</X>
<Y>
<Values>
<cc1:ChartYData DoubleValue="20" />
<cc1:ChartYData DoubleValue="20" />
<cc1:ChartYData DoubleValue="30" />
<cc1:ChartYData DoubleValue="20" />
<cc1:ChartYData DoubleValue="10" />
</Values>
</Y>
</Data>
</cc1:CompositeChartSeries>
<cc1:CompositeChartSeries Label="East" LegendEntry="True" Type="Column">
<Data>
<X>
<Values>
<cc1:ChartXData StringValue="Desktops" />
<cc1:ChartXData StringValue="Notebooks" />
<cc1:ChartXData StringValue="AIO" />
<cc1:ChartXData StringValue="Tablets" />
<cc1:ChartXData StringValue="Phones" />
</Values>
</X>
<Y>
<Values>
<cc1:ChartYData DoubleValue="30" />
<cc1:ChartYData DoubleValue="40" />
<cc1:ChartYData DoubleValue="40" />
<cc1:ChartYData DoubleValue="20" />
<cc1:ChartYData DoubleValue="50" />
</Values>
</Y>
</Data>
</cc1:CompositeChartSeries>
<cc1:CompositeChartSeries Label="North" LegendEntry="True" Type="Column">
<Data>
<X>
<Values>
<cc1:ChartXData StringValue="Desktops" />
<cc1:ChartXData StringValue="Notebooks" />
<cc1:ChartXData StringValue="AIO" />
<cc1:ChartXData StringValue="Tablets" />
<cc1:ChartXData StringValue="Phones" />
</Values>
</X>
<Y>
<Values>
<cc1:ChartYData DoubleValue="30" />
<cc1:ChartYData DoubleValue="60" />
<cc1:ChartYData DoubleValue="20" />
<cc1:ChartYData DoubleValue="90" />
<cc1:ChartYData DoubleValue="50" />
</Values>
</Y>
</Data>
</cc1:CompositeChartSeries>
<cc1:CompositeChartSeries LegendEntry="True" Type="Pie">
<PieSeriesList>
<cc1:PieChartSeries Data="46.78" Label="MacBook Pro" LegendEntry="True"
Offset="15">
</cc1:PieChartSeries>
<cc1:PieChartSeries Data="23.18" Label="iMac" LegendEntry="True">
</cc1:PieChartSeries>
<cc1:PieChartSeries Data="20.25" Label="MacBook" LegendEntry="True">
</cc1:PieChartSeries>
</PieSeriesList>
</cc1:CompositeChartSeries>
</SeriesList>
<Footer Compass="South" Visible="False">
</Footer>
<Axis>
<Y Compass="West" Visible="False">
<Labels TextAlign="Center">
</Labels>
<GridMajor Visible="True">
</GridMajor>
</Y>
</Axis>
</cc1:C1CompositeChartExtender>
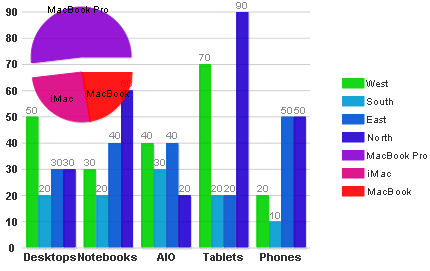
This Topic Illustrates the Following:The following image shows a C1CompositeChart with two chart types added, Bar and Pie: