In This Topic
Data can be added to the Bar chart by defining a series. Once you add a series you can add the ChartXData and ChartYData. The following values can be added to the ChartXData or ChartYData: DateTimeValue, DoubleValue, and StringValue. In this example you will use string values for the ChartXData and double values for ChartYData.
To add data to the bar chart using the BarChartSeries Collection, complete the following:
-
In your Web application, add a reference to the C1.Web.Wijmo.Extenders.3.dll and then add a standard Panel control to the main content of your page.
-
Click the Panel smart tag and select Add Extender from the Panel Tasks menu.
-
In the Extender Wizard, select C1BarChartExtender and click OK. A C1BarChartExtender control is added to the page and the TargetControlID is set to Panel1.
<cc1:C1BarChartExtender ID="Panel1_C1BarChartExtender" runat="server"
TargetControlID="Panel1">
<footer compass="South" visible="False">
</footer>
<axis>
<y compass="West" visible="False">
<labels textalign="Center">
</labels>
<gridmajor visible="True">
</gridmajor>
</y>
</axis>
</cc1:C1BarChartExtender>
-
Select View | Properties Window in the Visual Studio menu.
-
Click the drop-down list at the top of the Properties window and select Panel1_C1BarChartExtender.
-
Locate the SeriesList and click on the ellipsis button next to the SeriesList item. The BarChartSeries Collection Editor appears.
-
In the BarChartSeries Collection Editor, click the Add buton to add a new BarChartSeries to the BarChart.
-
Select Data -> X from the properties pane in the BarChartSeries Collection Editor and click the ellipsis button next to the Values property to open the ChartXData Collection Editor.
-
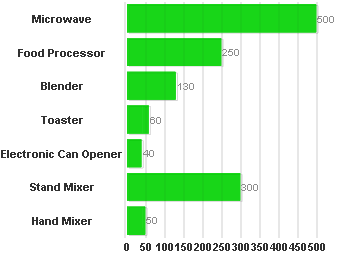
Click Add seven times to add seven members and enter the following values next to to the StringValue property for each member: “Hand Mixer”, “Stand Mixer”, “Electronic Can Opener”, “Toaster”, “Blender”, “Food Processor” and “Microwave”.
-
Click OK to save and close the ChartXData Collection Editor.
-
Select Data -> Y from the properties pane in the BarChartSeries Collection Editor and and click the ellipsis button next to the Values property to open the ChartXData Collection Editor.
-
Click Add seven times to add seven members and enter the following data next to the DoubleValues property: 50, 300, 40, 60, 130, 250, 500.
-
Click OK to save and close the ChartYData Collection Editor.
-
Set LegendEntry to False and click OK to save and close the BarChartSeries Collection Editor.
This topic illustrates the following: