Step 5 of 5: Running the Project
In This Topic
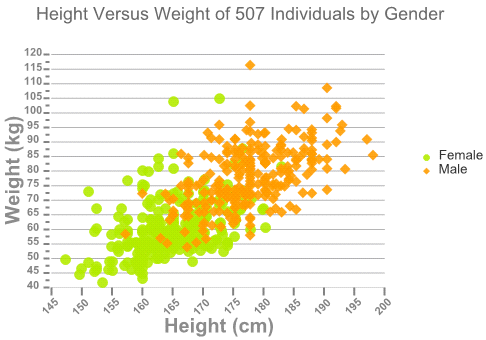
Press F5 to run the project and view the following:
- Notice how the data for the scatter comes into view from left to right due to the animation.
- The two data sets, Male and Female, are easily compared using the scatter chart. Here you can immediately see that the woman are shorter and weigh less than the men do.
- The scatter chart elements appear customized.
- A tooltip appears when you hover over a data point. It details the x and y values for each data point.

See Also
