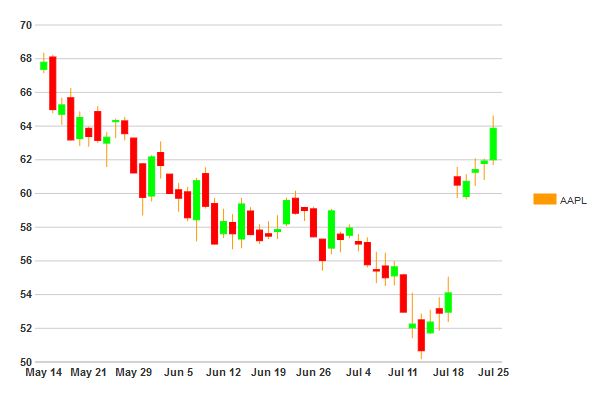
Binding the C1CandlestickChart control to remote data happens on the client side.
To complete this topic, you should first add a C1CandlestickChart control to your application and name it C1CandlestickChart1 before adding the script references within the <head> </head> tags. You can find the references by clicking this link.
The script below binds the chart to the remote data source, configures the data, and customizes the chart through the ChartStyles properties. Note that the script should be placed within the <head> </head> tags in your project, below the script references:
| Script |
Copy Code
|
|---|---|
    <script type = "text/javascript">
       $(document).ready(function () {
                $.getJSON('http://www.highcharts.com/samples/data/jsonp.php?filename=aapl-ohlc.json&callback=?', function (data) {
                    var count = 50,
                        length = data.length,
                        dt = {},
                        x = [],
                        high = [],
                        low = [],
                        open = [],
                        close = [];
                    $.each(data, function (i, d) {
                        if (i > count) {
                            return false;
                        }
                        x.push(new Date(d[0]));
                        open.push(d[1]);
                        high.push(d[2]);
                        low.push(d[3]);
                        close.push(d[4]);
                    })
                    dt = {
                        x: x,
                        high: high,
                        low: low,
                        open: open,
                        close: close
                    };
                    $("#C1CandlestickChart1").wijcandlestickchart({
                        type: "candlestick",
                        hint: {
                            content: function () {
                                return this.label + '\n' + this.x + '\n High:' + this.high + '\n Low:' + this.low + '';
                            }
                        },
                        barFormater: function (obj) {
                            var eles = obj.eles,
                            data = obj.data,
                            open = data.open,
                            close = data.close,
                            hlEl = eles.highLow,
                            oEl = eles.open,
                            cEl = eles.close,
                            style = {};
                            if (open > close) {
                                style.stroke = "#00ff00";
                            }
                            else {
                                style.stroke = "#ff0000";
                            }
                            hlEl.attr(style);
                            oEl.attr(style);
                            cEl.attr(style);
                        },
                        seriesList: [{
                            label: "AAPL",
                            legendEntry: true,
                            data: dt
                        }],
                        seriesStyles: [{
                            highLow: { fill: "#ff9900", width: 1 },
                            open: { fill: "#ff9900", height: 2 },
                            close: { fill: "#ff9900", height: 2 },
                            fallingClose: { fill: "#ff0000", width: 6 },
                            raisingClose: { fill: "#00ff00", width: 6 }
                        }]
                    });
                });
             });
        </script>
|
|
This topic illustrates the following:
The following image shows the C1CandlestickChart bound to remote data:
