ComponentOne FinancialChart for UWP
Analytics / Indicators / Relative Strength Index
In This Topic
    Relative Strength Index
    In This Topic

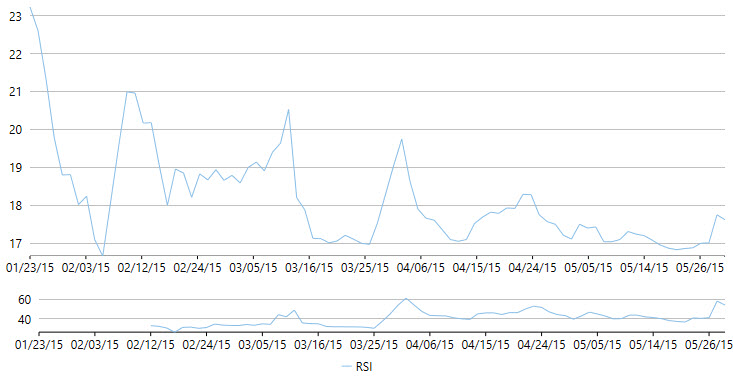
    Relative Strength Index (RSI) indicator for FinancialChart is a momentum oscillator, which measures velocity and magnitude of price movements. It compares the upward movements in closing price of an asset to the downward movements over a trading period, and intends to determine strength or weakness of a stock. It fluctuates between 0 and 100. The stocks with strong positive changes have a higher RSI than the stocks with strong negative changes.

    It finds application in comparing the magnitude of recent gains to recent losses, to determine the overbought and oversold conditions of an asset. Stocks are considered overbought when RSI is above 70, and oversold when below 30.

    FinancialChart also enables you to fetch the calculated RSI values at run-time using GetValues() method. This can help in creating alerts in application or maintaining logs while working with dynamic data.

    The following code snippet creates an instance of RSI class to work with Relative Strength Index. Notice that the given code snippet uses a class DataService.cs. To see the code for the class, refer to Average True Range.
    Partial Public Class Indicators
        Inherits Page
        Private dataService As DataService = dataService.GetService()
    
        Private rsi As New RSI() With {
            .SeriesName = "RSI"
        }
        Public Sub New()
            InitializeComponent()
        End Sub
    
        Public ReadOnly Property Data() As List(Of Quote)
            Get
                Return dataService.GetSymbolData("box")
            End Get
        End Property
    
        Public ReadOnly Property IndicatorType() As List(Of String)
            Get
                Return New List(Of String)() From {
                    "Relative Strength Index",
                }
            End Get
        End Property
    
        Sub OnIndicatorTypeSelectionChanged(sender As Object, e As SelectionChangedEventArgs)
            Dim ser As FinancialSeries = Nothing
    
            If cbIndicatorType.SelectedIndex = 1 Then
                ser = rsi
            End If
    
            If ser IsNot Nothing AndAlso Not indicatorChart.Series.Contains(ser) Then
                indicatorChart.BeginUpdate()
                indicatorChart.Series.Clear()
                indicatorChart.Series.Add(ser)
                indicatorChart.EndUpdate()
            End If
        End Sub
    
        Sub OnCbPeriodValueChanged(sender As Object, e As PropertyChangedEventArgs(Of Double))
            rsi.Period = 14
        End Sub
    
        Sub OnFinancialChartRendered(sender As Object, e As RenderEventArgs)
            If indicatorChart IsNot Nothing Then
                indicatorChart.AxisX.Min = (CType(financialChart.AxisX, IAxis)).GetMin()
                indicatorChart.AxisX.Max = (CType(financialChart.AxisX, IAxis)).GetMax()
            End If
        End Sub
    End Class
    
    public partial class Indicators : Page
    {
        DataService dataService = DataService.GetService();
        RSI rsi = new RSI() { SeriesName = "RSI" };
    
        public Indicators()
        {
            InitializeComponent();
        }
    
        public List<Quote> Data
        {
            get
            {
                return dataService.GetSymbolData("box");
            }
        }
    
        public List<string> IndicatorType
        {
            get
            {
                return new List<string>()
                {
                    "Relative Strength Index",
                };
            }
        }
    
        void OnIndicatorTypeSelectionChanged(object sender, SelectionChangedEventArgs e)
        {
            FinancialSeries ser = null;
            if (cbIndicatorType.SelectedIndex == 0)
                ser = rsi;
    
            if (ser != null && !indicatorChart.Series.Contains(ser))
            {
                indicatorChart.BeginUpdate();
                indicatorChart.Series.Clear();
                indicatorChart.Series.Add(ser);
                indicatorChart.EndUpdate();
            }
        }
    
        void OnCbPeriodValueChanged(object sender, PropertyChangedEventArgs<double> e)
        {
            rsi.Period = 14;
        }
    
        void OnFinancialChartRendered(object sender, RenderEventArgs e)
        {
            if (indicatorChart != null)
            {
                indicatorChart.AxisX.Min = ((IAxis)financialChart.AxisX).GetMin();
                indicatorChart.AxisX.Max = ((IAxis)financialChart.AxisX).GetMax();
            }
        }
    }