Home Tab
Home tab provides the most commonly-used commands such as cut-copy-paste, undo-redo, font formatting, alignment, border, data etc.

The Home tab consists of several menu functions arranged in the following groups:
Edit group
The Edit group consists of the following options:
- Paste: Pastes the last copied item.
- Cut: Cuts the selected item, removing it from the report and allowing it to be pasted elsewhere.
- Copy: Copies the selected item so that it can be pasted elsewhere.
- Delete: Deletes the selected item.
- Undo: Undoes the last change that was made to the report definition.
- Redo: Redoes the last change that was made to the report definition.
Text group
The Text group consists of the following options:
- Font: Displays the current font of the selected text and allows you to choose another font for the selected item (to do so, click the drop-down arrow next to the font name).
- Font Size: Displays the current font size of the selected text and allows you to choose another font size. Type a number in the font size box or click the drop-down arrow to choose a font size.
- Increase Font Size: Increases the font size by one point.
- Decrease Font Size: Decreases the font size by one point.
- Bold: Makes the selected text bold (you can also press CTRL+B).
- Italic: Italicizes the selected text (you can also press CTRL+I).
- Underline: Underlines the selected text (you can also press CTRL+U).
- Align General: Aligns numbers to left and other values to right automatically.
- Align Text Left: Aligns text to the left.
- Center Text: Aligns text to the center.
- Align Text Right: Aligns text to the right.
- Justify Text: Justifies the selected text.
- Font Color: Allows you to select the color of the selected text.
- Fill Color: Allows you to select the background color of the selected text.
Border group
The Border group consists of the following options:
- Border Line Style: Defines the style of the border lines of the currently selected field(s). The styles available are: Solid, Dash, Dot, Dash-Dot, Dash-Dot-Dot, and Transparent.
- Border Line Color: Defines the color of the border lines of the currently selected field(s).
- Border Line Width: Defines the thickness of border line of the currently selected field(s) in twips.
Format group
The Format group consists of the following options:
- Report Styles: Opens the Report Style Editor dialog box, where you can choose a built-in style or create and edit your own custom style.
- Format Painter: Applies style to the current selection.
- As Table Row: Formats the current selection as a table row.
You can access the Report Style Editor dialog box by clicking Report Styles in the Format group.
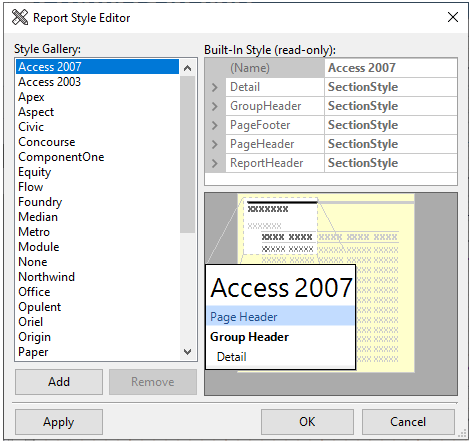
It consists of following elements:
- Style Gallery list: Displays all the currently available built-in and custom styles.
- Add button: Adds a custom style to the Style Gallery list. The style that is added is based on the style selected in the Style Gallery list when the Add button was clicked.
- Remove button: Removes a selected custom style. The button is enabled only when a custom style is selected in the Style Gallery list.
- Property grid: Lets you change the properties and edit a custom style. The Property grid is only available and editable when a custom style is selected in the Style Gallery list.
- Preview window: Displays a preview of the style selected in the Style Gallery list.
- Apply button: Applies the style to your selection without closing the dialog box.
- OK button: Closes the dialog box, applies your changes, and sets the style as the current selected style.
- Cancel button: Cancels any changes you have made to styles.
Data group
The Data group consists of the following options:
Data Sources: Clicking this button lists down the options Main and Add Data Source.

Main option lets you edit or remove the main data source to which the report is bound. Clicking Edit or Add Data Source opens the Data Sources dialog box. You can then choose a new data source, change the connection string, and edit the Sql statement. Clicking the drop down next to Data Source option displays the list of data sources present in the report. From the Data source tab, you can select the tables, views, and stored procedures in the current data source. Clicking the Sql statement tab allows you to view the current SQL statement:
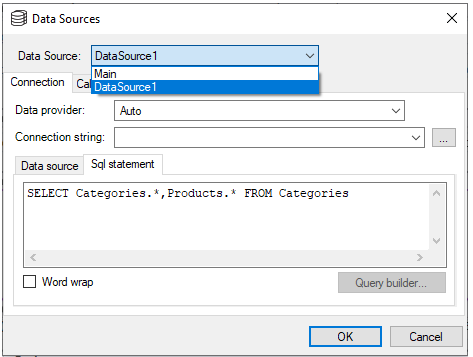
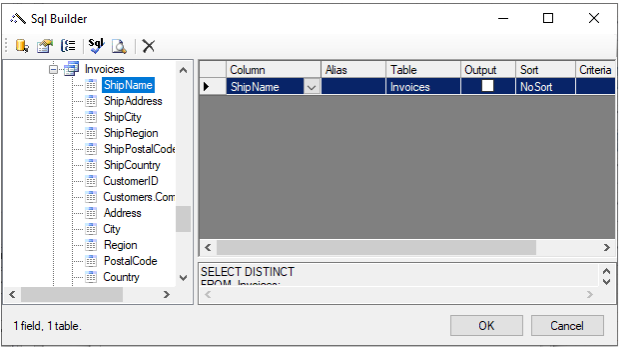
To change the connection string, click the ellipsis button. This will open the Data Link Properties dialog box. To edit or change the SQL statement, click the Query builder... button which will open the Sql Builder dialog box.
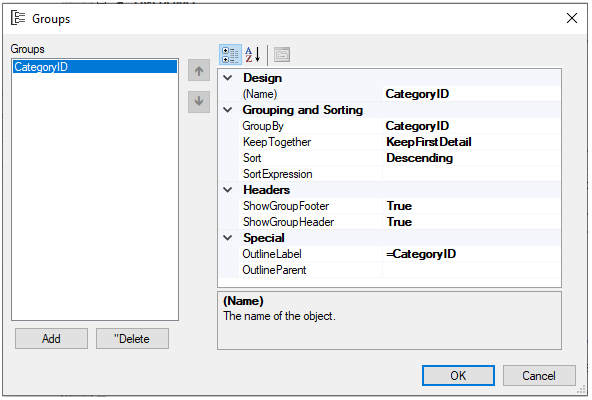
Groups: Clicking this button opens the Groups dialog box where you can add and delete grouping and sorting criteria.
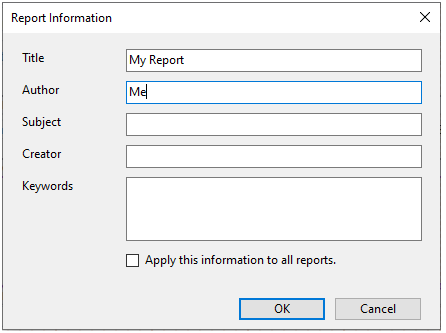
Report Info: Opens the Report Information dialog box, which allows you to set the report's Title, Author, Subject, Creator, and Keywords. You can also choose to apply report information to all reports.
VBScript Editor: Opens VBScript Editor - Report.GlobalScripts dialog box. Multiple scripts can be easily edited in the VBScript Editor, allowing users to switch between statements and expressions.
View group
The View group consists of the following options:
Properties: Brings the Properties tab into view on the left pane. The shortcut key for viewing the Properties tab is F4.
Data: Brings the Data tab into view on the left pane. The shortcut key combination for viewing the Data tab is Shift+F4.
Error List: Displays the list of warnings and errors generated while importing or previewing a report.
Captions: Lets you make a choice of viewing captions for sections or sub-sections in the designer panel. You can choose options - All (shows strip on all), Section (shows strip on sections and not subsections), Hairline (hides the section header strips), Hidden, Expand All and Collapse All options. The drop-down consists of the following options:
All Shows strip on all 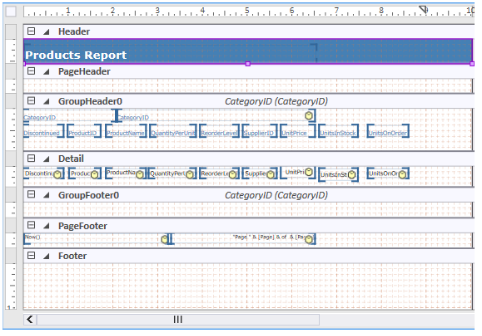
Section Shows strip on sections and not subsections 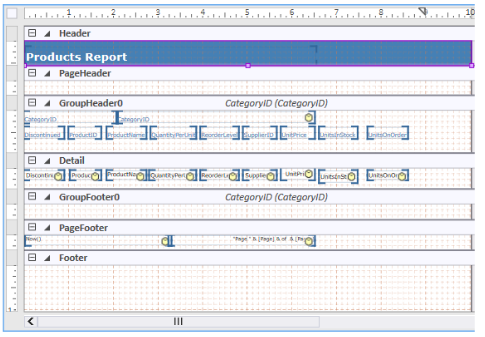
Hairline Hides the section header strips 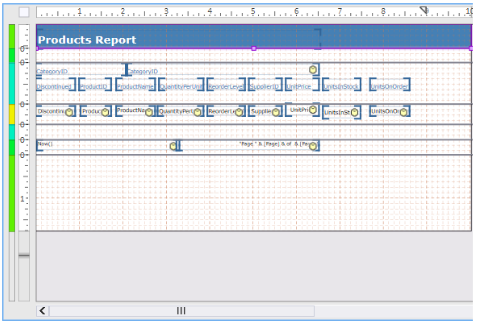
Hidden Hides strips 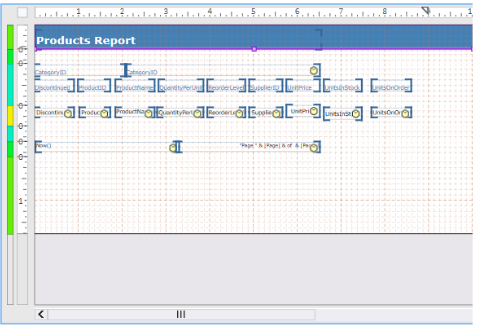
Expand All Expands all strips 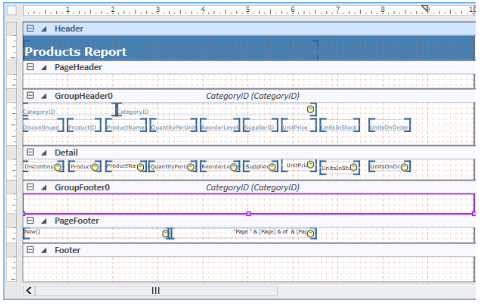
Collapse All Collapses all strips 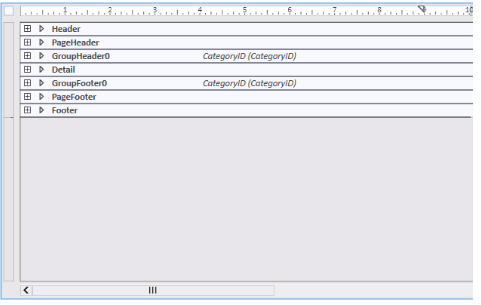
Zoom: Allows you to select a value to set the zoom level of the report. You can also press Ctrl+Plus or Ctrl+Minus to zoom in or zoom out the designer panel.


