# PivotGrid Customizations
Learn how to customize cells of Wijmo's OLAP PivotGrid in this tutorial
## Content
## Custom Cells
The **PivotGrid** extends the **FlexGrid** control, so you can customize the display of the grid cells using the **formatItem** event and modify the content of each cell with complete flexibility.
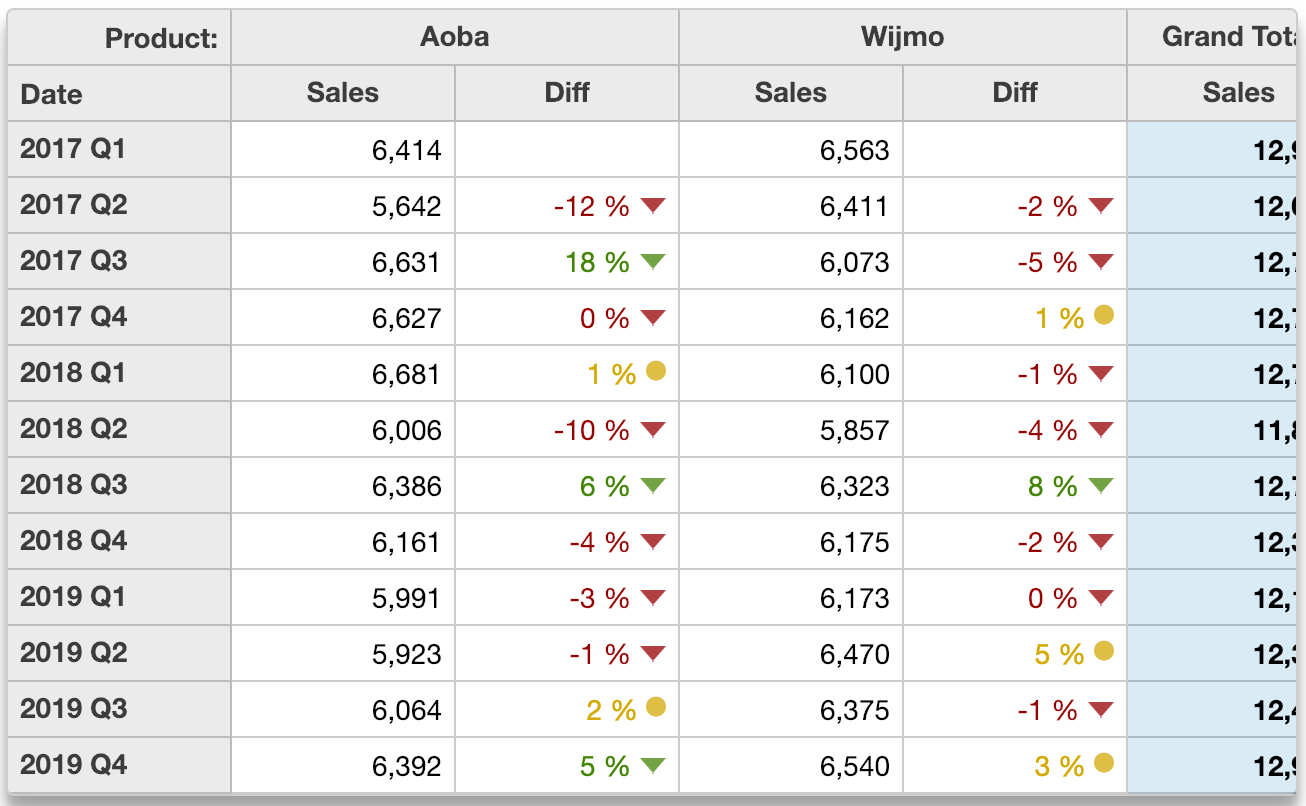
The **PivotGrid** below uses colors and icons similar to the ones in Microsoft Excel's icon sets to show how sales changed from quarter to quarter:
```javascript
var pivotGrid = new wjOlap.PivotGrid('#pivotGrid', {
isReadOnly: true,
itemsSource: ngFmt,
formatItem: formatItem // customize the grid cells
});
function formatItem(s, e) {
// we are interested in the cells panel
if (e.panel == s.cells) {
// remove custom color by default
var color = '';
// format diff columns if custom formatting is on
if (e.col % 2 == 1 && customCells.checked) {
var value = s.getCellData(e.row, e.col),
glyph = 'circle',
span = ' ';
color = '#d8b400';
if (value != null) {
if (value < 0) { // negative variation
color = '#9f0000';
glyph = 'down';
} else if (value > 0.05) { // positive variation
color = '#4c8f00';
glyph = 'down';
}
e.cell.innerHTML += span.replace('{glyph}', glyph);
}
}
// apply cell color
e.cell.style.color = color;
}
}
```
## Sparklines
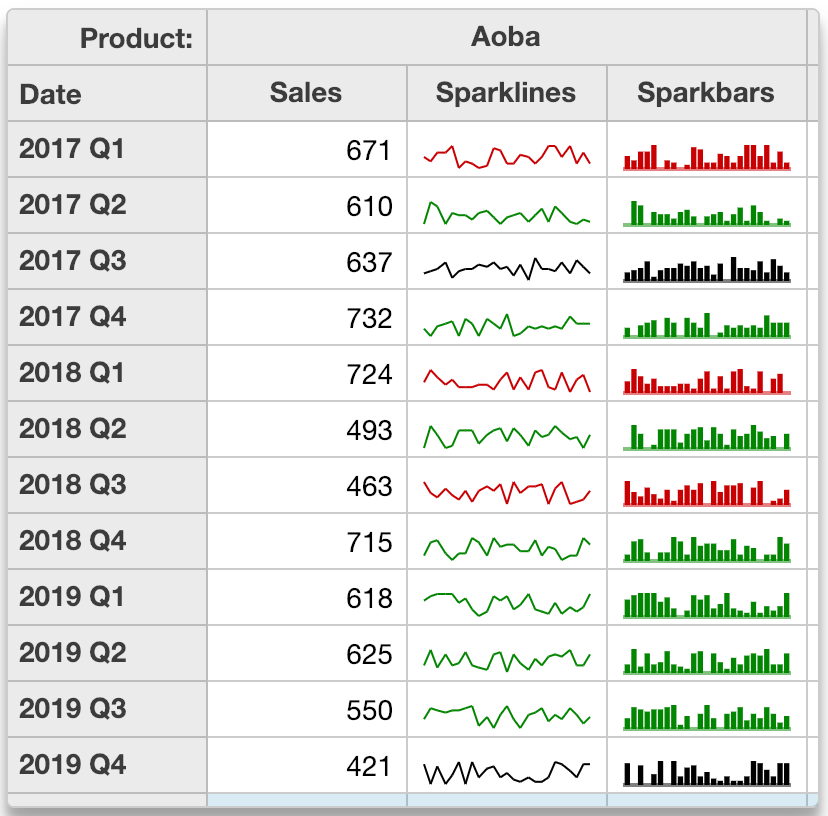
You can use the **formatItem** event to add custom content such as sparklines and sparkbars to grid cells also.
This example adds two extra fields to a PivotEngine and uses the formatItem event to add sparklines and sparkbars to the extra fields.
To do this, the sample uses the engine's getDetail method to retrieve the detail records for each cell and uses that data to build svg elements displayed in each cell. The cell details are stored in the data item so they can be re-used when the grid scrolls.
Refer to the Pivot Grid Sparklines demo for an example.
```javascript
var pivotGrid = new wjOlap.PivotGrid('#pivotGrid', {
isReadOnly: true,
itemsSource: ng,
formatItem: formatItem // customize the grid cells
});
// use formatItem to add sparklines and/or sparkbars
var maxSparkLength = 25;
function formatItem(s, e) {
// we want the cells panel
if (e.panel == s.cells) {
// we want the 'Sparklines' and 'Sparkbars' value fields
var ng = s.engine,
field = ng.valueFields[e.col % ng.valueFields.length],
item = s.rows[e.row].dataItem,
binding = s.columns[e.col].binding,
spark = field.header == 'Sparklines' || field.header == 'Sparkbars';
// add/remove spark class
wijmo.toggleClass(e.cell, 'spark', spark);
// add sparklines
if (spark) {
// if we have the data, show it
if (item.sparkData) {
var data = item.sparkData,
delta = data[data.length -1] - data[0];
e.cell.innerHTML = field.header == 'Sparklines' ? getSparklines(item.sparkData) : getSparkbars(item.sparkData);
wijmo.toggleClass(e.cell, 'spark-up', delta > 0);
wijmo.toggleClass(e.cell, 'spark-down', delta < 0);
}
// we dont have the data yet, so go get it
if (!item.sparkData) {
e.cell.innerHTML = '';
setTimeout(function() {
var detail = s.engine.getDetail(item, binding),
len = detail.length;
if (len > maxSparkLength) {
detail = detail.slice(len - maxSparkLength);
}
item.sparkData = detail.map(function(dataItem) {
return dataItem.sales;
});
s.invalidate(); // invalidate to show the sparlines
});
}
}
}
}
// generate sparklines as SVG
function getSparklines(data) {
var svg = '';
return svg;
}
function getSparkbars(data) {
var svg = '';
return svg;
}
function scaleY(value, min, max) {
return 100 - Math.round((value - min) / (max - min) * 100);
}
```
## HTML Content
Use the **PivotField**'s **isContentHtml** property to render fields that contain HTML instead of plain text.
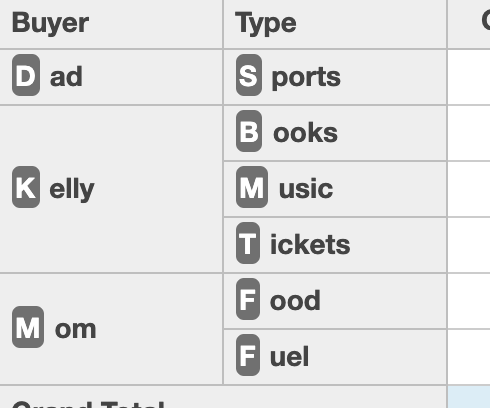
For example, in the array below the "Buyer" and "Type" fields are bound to properties that contain HTML text:
```javascript
[
{
date: new Date(yr, 0, 1),
buyer: 'Mom',
type: 'Fuel',
amount: 74
},
{
date: new Date(yr, 0, 15),
buyer: 'Mom',
type: 'Food',
amount: 235
},
{
date: new Date(yr, 0, 17),
buyer: 'Dad',
type: 'Sports',
amount: 20
},
{
date: new Date(yr, 0, 21),
buyer: 'Kelly',
type: 'Books',
amount: 125
},
{
date: new Date(yr, 1, 2),
buyer: 'Mom',
type: 'Food',
amount: 235
},
{
date: new Date(yr, 1, 20),
buyer: 'Kelly',
type: 'Music',
amount: 20
},
{
date: new Date(yr, 1, 25),
buyer: 'Kelly',
type: 'Tickets',
amount: 125
},
];
```
To enable the content to render HTML, set **isContentHTML** to **true**.
```javascript
var ng = new wjOlap.PivotEngine({
itemsSource: getData(), // raw data
valueFields: ['Amount'], // summarize amounts
rowFields: ['Buyer', 'Type'] // summarize amounts
});
ng.fields.getField('Buyer').isContentHtml = true;
ng.fields.getField('Type').isContentHtml = true;
```
##### Result