# HighLowOpenClose Charts with FlexChart
Learn how to create high low open close charts using Wijmo's FlexChart in this documentation topic
## Content
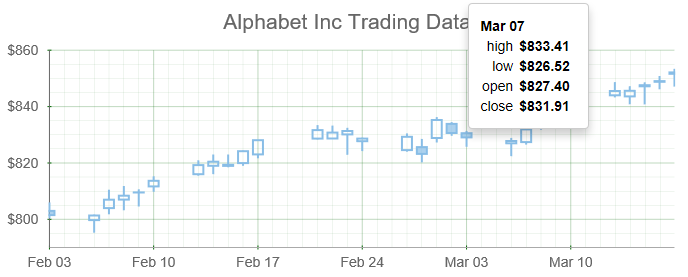
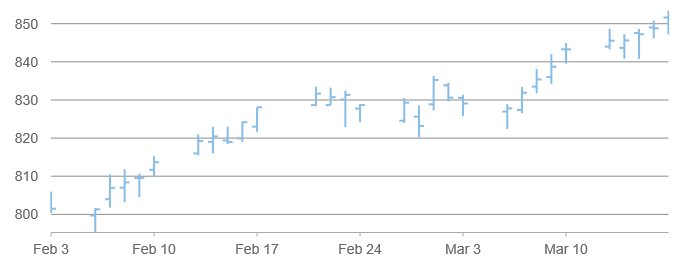
HighLowOpenClose charts are used to describe price movements of a security, derivative, or currency over time. They are similar to candlestick charts, except opening values are displayed using lines to the left, and closing values are displayed using lines to the right. The size of the vertical line is determined by the High and Low values.
To create HighLowOpenClose charts with the FlexChart control, set the __bindingX__ property to the name of the property that contains the dates, and add a single series with __binding__ set to a comma-delimited string containing the names of the properties that represent the High, Low, Open, and Close values (in that exact order). And set the __chartType__ to 'HighLowOpenClose'.
Example:
```JavaScript
import * as chart from '@mescius/wijmo.chart';
// create the chart
var myChart = new chart.FlexChart('#myChart', {
itemsSource: getData(),
bindingX: 'date',
chartType: 'HighLowOpenClose',
series: [
{ binding: 'high,low,open,close', name: 'Alphabet Inc' }
]
});
```
## Customizing the Tooltip
Since the HighLowOpenClose chart type has more than just one value plotted, it can be helpful for the user to display more information than the default tooltip provides.
The tooltip's __content__ property is an HTML template that may contain information about the series, the data point, and the data element. For example:
```JavaScript
myChart.tooltip.content = '{date:MMM dd}
' +
'' +
'| high | {high:c} |
|
' +
'| low | {low:c} |
|
' +
'| open | {open:c} |
|
' +
'| close | {close:c} |
|
' +
'
';
```
In this example, 'date', 'high', 'low', 'open', and 'close' are the names of the bound fields.