# Data Labels in FlexChart
Learn how to display data labels using Wijmo's FlexChart in this documentation topic
## Content
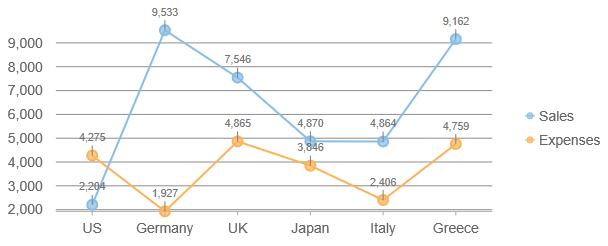
The **dataLabels** property allows you to show labels next to each data point on the chart.
To use it, set the following properties on the **dataLabels** object:
* **content**: String template with property holders, similar to the string used to define tooltip content. For example, '{value:n0}'.
* **position**: A **LabelPosition** value that determines where to place the labels relative to the data points.
* **connectingLine**: Whether to draw a line connecting the labels and corresponding data points.
* **border**: Whether to draw a border around the label.
* **offset**: The offset distance in points from the data point. This is commonly used with the connecting line.
FlexChart Example:
```JavaScript
import * as wjChart from '@mescius/wijmo.chart';
var myChart = new wjChart.FlexChart('#myChart');
myChart.dataLabel.content = '{value:n0}';
myChart.dataLabel.position = 'Top'; // Top, Left, Right, Center, Bottom, None
myChart.dataLabel.connectingLine = true;
myChart.dataLabel.border = true;
myChart.dataLabel.offset = 10;
```
## Data Label Content
When the label content is a string, it can contain any of the following placeholders:
* **seriesName**: Name of the series that contains the data point (FlexChart only).
* **pointIndex**: Index of the data point.
* **value**: Value of the data point.
* **x**: x-value of the data point (FlexChart only).
* **y**: y-value of the data point (FlexChart only).
* **name**: Name of the data point.
* **propertyName**: any property of data object.
The parameter must be enclosed in curly brackets, for example 'x={x}, y={y}'. Additionally, bound field names can be included like '{country}' and '{item.otherData}'.
Example:
```JavaScript
// Create a chart and show y data in labels positioned above the data point.
var myChart = new wjChart.FlexChart('#myChart');
myChart.initialize({
itemsSource: data,
bindingX: 'country',
series: [
{ name: 'Sales', binding: 'sales' },
{ name: 'Expenses', binding: 'expenses' },
{ name: 'Downloads', binding: 'downloads' }],
});
myChart.dataLabel.position = 'Top';
myChart.dataLabel.content = '{country} {seriesName}:{y}';
```
For a more complex data label layout, that can include mixed formatting, use additional **tspan** elements within the content. The following example applies bold to some text and changed color of value.
```JavaScript
myChart.dataLabel.content =
'{country}' +
':{value:n0}';
```
The content can also be specified as a function that takes a **HitTestInfo** object as a parameter. The next example shows how to set data label content using a function.
```JavaScript
// Set the data label content
myChart.dataLabel.content = function (ht) {
return ht.name + ":" + ht.value.toFixed();
}
```
## FlexPie Data Labels
Data labels work the same for FlexPie as FlexChart and FlexRadar, however the available positions are unique for a radial pie chart.
FlexPie Data Label Positions:
* Inside: The label appears inside the pie slice.
* Outside: The label appears outside the pie slice.
* Center: The label appears at the center of the pie slice.
* Radial: The label appears inside the pie slice and depends of its angle.
* Circular: The label appears inside the pie slice and has circular direction.
* None: A quick way to toggle the data labels visibility.
FlexPie data label example:
```JavaScript
var myChart = new wjChart.FlexPie('#myChart');
myChart.dataLabel.content = '{value:n0}';
myChart.dataLabel.position = 'Outside';
myChart.dataLabel.connectingLine = true;
myChart.dataLabel.border = true;
myChart.dataLabel.offset = 10;
```
## Custom Data Label Rendering
The data label content can also be customized within the rendering event. The data label rendering event args **cancel** property can be used to cancel the rendering for a particular data point, and the **text** property can be used to conditionally set the data label content.
Example:
```JavaScript
// custom render labels only for the "downloads" series
myChart.dataLabel.rendering = function(s, e) {
if (downloadsOnly && e.hitTestInfo.series.binding != 'downloads') {
e.cancel = true;
}
e.text = 'nanana';
}
```