# Annotations in FlexChart
Learn how to add annotations using Wijmo's FlexChart in this documentation topic
## Content
Annotations are used to highlight notable points or areas on the chart. Annotations can also be used to place arbitrary elements such as images, shapes and text onto the chart. The FlexChart control supports various built-in annotations such as Rectangle, Square, Circle, Ellipse, Line, Polygon, Image, and Text.
The annotations may be attached to specific data points or to arbitrary points in data or page coordinates.
To add annotations to a FlexChart, follow these steps:
1. Create an **AnnotationLayer** attached to the chart and
2. Populate it with annotation objects such as Ellipse, Rectangle, Image or Text.
3. For each annotation, set its **attachment** property to determine how its attached to the chart.
4. Set additional properties on the annotation, such as **pointIndex** and **seriesIndex** if the annotation is attached to a point.
Example:
```JavaScript
import * as wjChart from '@mescius/wijmo.chart';
import * as wjAnnotation from '@mescius/wijmo.chart.annotation';
// add annotation layer
var annotations = new wjAnnotation.AnnotationLayer(myChart);
// attach Ellipse annotation to data point 5
annotations.items.push({
type: 'Ellipse',
content: 'Ellipse',
tooltip: 'This is an Ellipse
annotation',
attachment: 'DataIndex',
seriesIndex: 0,
pointIndex: 5,
width: 100,
height: 40,
position: 'Top',
style: {
fill: 'green',
stroke: 'darkgreen',
strokeWidth: 2,
opacity: .25
}
}
);
```
The annotation collection may also be passed in as a parameter to the **AnnotationLayer** constructor.
## Annotation Types
FlexChart supports the following built-in types of annotations.
* **Circle**: Represents a circle annotation. Set the **radius** property to set the size.
* **Ellipse**: Represents an ellipse annotation. Set the **height** and **width** properties to set the size.
* **Image**: Represents and image annotation. Set the **href**, **height**, and **width** properties to configure the image.
* **Line**: Represents a line annotation. Set the **end** and **start** point properties to configure the line.
* **Polygon**: Represents a polygon annotation. Set the **points** property to configure the polygon shape.
* **Rectangle**: Represents a rectangle annotation. Set the **height** and **width** properties to set the size.
* **Square**: Represents a square annotation. Set the **length** property to set the size.
* **Text**: Represents a text annotation. Set the **text** property to set the text.
Example of Line Annotation:
```JavaScript
// show a trendline between Jan 31 and Feb 27
annotations.items.push({
type: 'Line',
tooltip: 'This is a Line
annotation',
position: 'Center',
attachment: 'DataCoordinate',
start: { x: new Date(2017, 0, 31), y: 810 },
end: { x: new Date(2017, 1, 28), y: 840 },
style: {
stroke: 'darkgreen',
strokeWidth: 4,
opacity: .5 }
}
);
```
Example of Image Annotation:
```JavaScript
// show a map marker image
annotations.items.push({
type: 'Image',
href: 'https://maps.google.com/mapfiles/marker_green.png',
width: 15,
height: 30,
attachment: 'DataCoordinate',
point: { x: new Date(2017, 1, 7), y: 800},
tooltip: 'Time to buy!',
}
);
```
All annotations have the following common properties:
* **attachment**: The attachment technique. See next topic for more details.
* **isVisible**: The visibility of the annotation (true/false).
* **name**: The name of the annotation.
* **offset**: The offset (point) of the annotation from the attachment point.
* **point**: The coordinate point of the annotation for DataCoordinate and Absolute attachment techniques.
* **pointIndex**: The data point index. Applies only when the **attachment** property is set to DataIndex.
* **position**: The position of the annotation relative to the attachment point. (Center/Top/Bottom/Left/Right).
* **seriesIndex**: The data series index of the annotation. Applies only when the **attachment** property is set to DataIndex.
* **style**: Style properties that specifies SVG styling attributes, including fill, stroke, strokeWidth, and so on.
* **tooltip**: The tooltip string of the annotation.
## Annotation Attachments
FlexChart annotations support the following attachment techniques.
* **DataIndex**: Coordinates of the annotation point are defined by the data series index and the data point index.
* **DataCoordinate**: Annotation point is specified in data coordinates.
* **Relative**: Annotation point is specified as a relative position inside the control where (0,0) is the top left corner and (1,1) is the bottom right corner.
* **Absolute**: The annotation point is specified in control's pixel coordinates.
### Attaching Annotations to Data Points
To attach an annotation to a specific data point, follow these steps:
1. Set the **attachment** property to DataIndex.
2. Set the **seriesIndex** to the index of the attached series. If the chart has only one series then this value should be set to 0.
3. Set the **pointIndex** to the index of the data point within the attached series.
4. Set additional properties to configure the appearance.
Example:
```JavaScript
// attach annotation to the 5th data point in first series
annotations.items.push({
type: 'Text',
attachment: 'DataIndex',
seriesIndex: 0,
pointIndex: 5,
text: 'Annotation'
}
);
```
### Attaching Annotations by Data Coordinate
To attach an annotation anywhere on the plot coordinate system, follow these steps:
1. Set the **attachment** property to DataCoordinate.
2. Set the **point** to plot coordinates.
3. Set additional properties to configure the appearance.
Example:
```JavaScript
// attach annotation at x: 10, y: 80
annotations.items.push({
type: 'Text',
attachment: 'DataCoordinate',
point: { x: 10, y: 80},
text: 'Annotation'
}
);
```
## Using Rectangle Annotations to Create Zones
You can use annotations to create chart zones. Zones are colored regions of the plot area behind the data points used to highlight a range of values.
For example, the chart below has 'buy' and 'sell' zones represented by green and red Rectangle annotations:
```JavaScript
// add annotation layer with two rectangle annotations
var annotations = new wjAnnotation.AnnotationLayer(myChart, [
{
type: 'Rectangle',
attachment: 'DataCoordinate',
point: { x: new Date(2017, 0, 1), y: 855},
position: 1, // Center Top Bottom Left Right
width: 20000, height: 20000,
style: { fill: 'red', opacity: .15 }
},
{
type: 'Rectangle',
attachment: 'DataCoordinate',
point: { x: new Date(2017, 0, 1), y: 815},
position: 2, // Center Top Bottom Left Right
width: 20000, height: 20000,
style: { fill: 'green', opacity: .15 }
}
]);
```
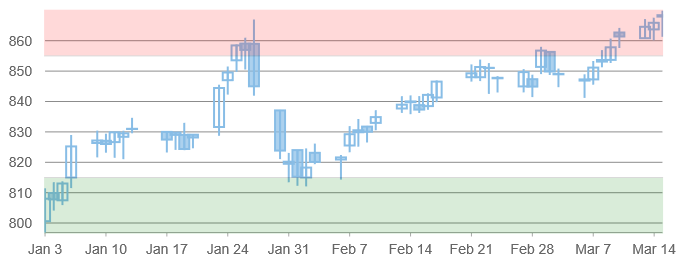
The Polygon annotation can be used to create zones with plot-bound points around all edges when used with DataCoordinate attachment. The example below shows a polygon annotation with absolute positioning.
```JavaScript
// add annotation layer with polygon annotation
var annotations = new wjAnnotation.AnnotationLayer(myChart, [
{
type: "Polygon",
content: "Absolute",
position: 0,
style: {
fill: "#FE2E2E",
stroke: "#01A9DB",
fill-opacity: 2,
stroke-width: 4,
stroke-opacity: 1
},
points: [
{ "x": 200, "y": 0 },
{ "x": 150, "y": 50 },
{ "x": 175, "y": 100 },
{ "x": 225, "y": 100 },
{ "x": 250, "y": 50 }
]
}
]);
```