Pie Plot Types
In This Topic
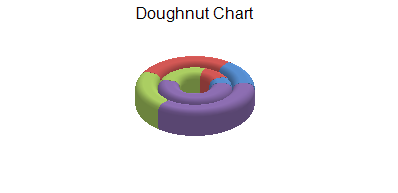
A pie plot area contains series that have values in one dimension. When visualized in two dimensions, a pie plot area takes the form of a circle (or partial circle). When visualized in three dimensions, a pie plot area takes the form of a disk (or partial disk). The following image displays a three dimensional chart.

You can have any of these types of Pie plots:
For details on the API, refer to the PiePlotArea class.