# Column, Line, and Winloss Sparkline
Learn how to create dynamic column and line sparklines using Spread.NET with this comprehensive guide.
## Content
You can create standard sparkline types such as column, line, and winloss sparklines and enhance these sparklines by adding other styles and technical properties that can make the presentation of your data more appealing.

The column, line, and winloss formulas have the following format:
`=COLUMNSPARKLINE(data, dataOrientation, [dateAxisData, dateAxisOrientation, setting])`
`=LINESPARKLINE(data, dataOrientation, [dateAxisData, dateAxisOrientation, setting])`
`=WINLOSSSPARKLINE(data, dataOrientation, [dateAxisData, dateAxisOrientation, setting])`
> !type=note
> **Note:** You can also add column, loss, or winloss sparklines using methods. Refer to [Add Sparklines Using Methods](/spreadnet/docs/latest/online-win/overview/spwin-devguide/spwin-sparkline/spwin-sparkadd) for more information.
The formula options are described below:
| **Option** | **Description** |
| ------ | ----------- |
| Data | A range reference that represents sparkline data. For example: A1:C3. |
| DataOrientation | A number that represents the sparkline data orientation, 0 is vertical, 1 is horizontal. |
| DateAxisData *Optional* | A range reference that represents sparkline date axis data. For example: D1:F3. |
| DateAxisOrientation *Optional* | A number that represents the sparkline date axis orientation, 0 is vertical, 1 is horizontal. |
| Setting *Optional* | An array of settings. For example: `"{axisColor:#FFFFFF00,firstMarkerColor:"brown",highMarkerColor:"red",lastMarkerColor:"blue",lowMarkerColor:"green",markersColor:"purple",negativeColor:"yellowgreen", seriesColor:"pink",displayXAxis:true,showFirst:true,showHigh:true,showLast:true,showLow:true,showNegative:true,showMarkers:true,lineWeight:3,displayHidden:false,displayEmptyCellsAs:1,rightToLeft:false,minAxisType:1,maxAxisType:1,manualMax:5,manualMin:-3}".` Every property has a default value. |
The following table lists the full name and the equivalent sparkline setting that can be used in the **Setting** parameter above. The table also lists the corresponding short names for the parameters, as ExcelIO has length limitation and allows max 255 characters.
| **Full Name** | **Excel Sparkline Setting** | **Short Name** |
| --------- | ----------------------- | ---------- |
| AXISCOLOR | axisColor | ac |
| FIRSTMARKERCOLOR | firstMarkerColor | fmc |
| HIGHMARKERCOLOR | highMarkerColor | hmc |
| LASTMARKERCOLOR | lastMarkerColor | lastmc |
| LOWMARKERCOLOR | lowMarkerColor | lowmc |
| MARKERSCOLOR | markersColor | mc |
| NEGATIVECOLOR | negativeColor | nc |
| SERIESCOLOR | seriesColor | sc |
| DISPLAYEMPTYCELLSAS | displayEmptyCellsAs | deca |
| RIGHTTOLEFT | rightToLeft | rtl |
| DISPLAYHIDDEN | displayHidden | dh |
| DISPLAYXAXIS | displayXAxis | dxa |
| SHOWFIRST | showFirst | sf |
| SHOWHIGH | showHigh | sh |
| SHOWLAST | showLast | slast |
| SHOWLOW | showLow | slow |
| SHOWNEGATIVE | showNegative | sn |
| SHOWMARKERS | showMarkers | sm |
| MANUALMAX | manualMax | mmax |
| MANUALMIN | manualMin | mmin |
| MAXAXISTYPE | maxAxisType | maxat |
| MINAXISTYPE | minAxisType | minat |
| LINEWEIGHT | lineWeight | lw |
> !type=note
> **Note:** Column, line, and winloss sparklines will be exported as Excel cell sparklines if Exchangeable flag is not used.
## Usage Scenario
Consider a scenario where a company tracks its revenue throughout a year. It analyzes the evolution of values as well as their highs and lows. Column, line, and winloss sparklines will showcase the high values and indicate fluctuations in height differences.
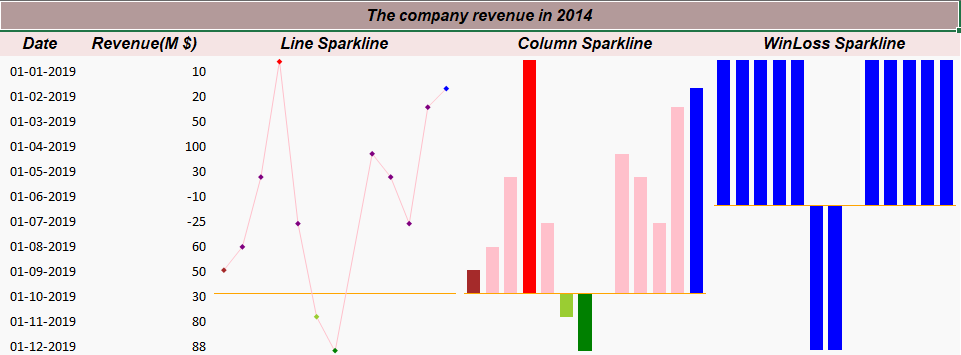
```csharp
// Get sheet
var worksheet = fpSpread1_Sheet1.AsWorksheet();
// Set data
fpSpread1_Sheet1.SetValue(1, 0, "Date");
fpSpread1_Sheet1.SetValue(1, 1, "Revenue(M $)");
fpSpread1_Sheet1.SetValue(1, 2, "Line Sparkline");
fpSpread1_Sheet1.SetValue(1, 3, "Column Sparkline");
fpSpread1_Sheet1.SetValue(1, 4, "WinLoss Sparkline");
for (var i = 2; i < 14; i++)
{
fpSpread1_Sheet1.SetValue(i, 0, new DateTime(2019, i - 1, 1));
}
fpSpread1_Sheet1.SetValue(2, 1, 10);
fpSpread1_Sheet1.SetValue(3, 1, 20);
fpSpread1_Sheet1.SetValue(4, 1, 50);
fpSpread1_Sheet1.SetValue(5, 1, 100);
fpSpread1_Sheet1.SetValue(6, 1, 30);
fpSpread1_Sheet1.SetValue(7, 1, -10);
fpSpread1_Sheet1.SetValue(8, 1, -25);
fpSpread1_Sheet1.SetValue(9, 1, 60);
fpSpread1_Sheet1.SetValue(10, 1, 50);
fpSpread1_Sheet1.SetValue(11, 1, 30);
fpSpread1_Sheet1.SetValue(12, 1, 80);
fpSpread1_Sheet1.SetValue(13, 1, 88);
// Add span cells
fpSpread1_Sheet1.AddSpanCell(2, 2, 12, 1);
fpSpread1_Sheet1.AddSpanCell(2, 3, 12, 1);
fpSpread1_Sheet1.AddSpanCell(2, 4, 12, 1);
// Set sparkline formulas
worksheet.Cells[2, 2].Formula = "LINESPARKLINE(B3:B14,0,A3:A14,0,{\"ac\",\"orange\";\"fmc\",\"brown\";\"highMarkerColor\",\"red\";\"lastMarkerColor\",\"blue\";\"lowMarkerColor\",\"green\";\"markersColor\",\"purple\";\"negativeColor\",\"yellowgreen\";\"seriesColor\",\"pink\";\"displayXAxis\",true;\"showFirst\",\"true\";\"showHigh\",\"true\";\"showLast\",\"true\";\"showLow\",\"true\";\"showNegative\",\"true\";\"showMarkers\",\"true\";\"lineWeight\",\"1\";\"displayHidden\",\"false\";\"DISPLAYBLANKSAS\",\"Interpolated\";\"rightToLeft\",\"false\";\"minAxisType\",\"Single\";\"maxAxisType\",\"Custom\";\"manualMax\",\"100\";\"manualMin\",\"-1\"})";
worksheet.Cells[2, 3].Formula = "COLUMNSPARKLINE(B3:B14,0,A3:A14,0,{\"AXISCOLOR\",\"pink\";\"firstMarkerColor\",\"brown\";\"highMarkerColor\",\"red\";\"lastMarkerColor\",\"blue\";\"lowMarkerColor\",\"green\";\"markersColor\",\"purple\";\"negativeColor\",\"yellowgreen\";\"seriesColor\",\"pink\";\"displayXAxis\",true;\"showFirst\",\"true\";\"showHigh\",\"true\";\"showLast\",\"true\";\"showLow\",\"true\";\"showNegative\",\"true\";\"showMarkers\",\"true\";\"lineWeight\",\"1\";\"displayHidden\",\"false\";\"DISPLAYBLANKSAS\",\"Interpolated\";\"rightToLeft\",\"false\";\"minAxisType\",\"Single\";\"maxAxisType\",\"Custom\";\"manualMax\",\"100\";\"manualMin\",\"-1\"})";
worksheet.Cells[2, 4].Formula = "WINLOSSSPARKLINE(B3:B14,0,A3:A14,0,{\"axisColor\",\"orange\";\"firstMarkerColor\",\"blue\";\"highMarkerColor\",\"blue\";\"lastMarkerColor\",\"blue\";\"lowMarkerColor\",\"blue\";\"markersColor\",\"blue\";\"negativeColor\",\"blue\";\"seriesColor\",\"blue\";\"displayXAxis\",true;\"showFirst\",\"true\";\"showHigh\",\"true\";\"showLast\",\"true\";\"showLow\",\"true\";\"showNegative\",\"true\";\"showMarkers\",\"true\";\"lineWeight\",\"1\";\"displayHidden\",\"false\";\"DISPLAYBLANKSAS\",\"Interpolated\";\"rightToLeft\",\"false\";\"minAxisType\",\"Single\";\"maxAxisType\",\"Custom\";\"manualMax\",\"100\";\"manualMin\",\"-1\"})";
// Set backcolor for cells
worksheet.Cells["A1"].Interior.Color = GrapeCity.Spreadsheet.Color.FromArgb(unchecked((int)0xFFB39A9A));
worksheet.Cells["A2:E2"].Interior.Color = GrapeCity.Spreadsheet.Color.FromArgb(unchecked((int)0xFFF5E4E4));
worksheet.Cells["A3:E14"].Interior.Color = GrapeCity.Spreadsheet.Color.FromArgb(unchecked((int)0xFFF9F9F9));
```
```vbnet
'Get sheet
Dim worksheet = FpSpread1_Sheet1.AsWorksheet()
'Set data
FpSpread1_Sheet1.SetValue(1, 0, "Date")
FpSpread1_Sheet1.SetValue(1, 1, "Revenue(M $)")
FpSpread1_Sheet1.SetValue(1, 2, "Line Sparkline")
FpSpread1_Sheet1.SetValue(1, 3, "Column Sparkline")
FpSpread1_Sheet1.SetValue(1, 4, "WinLoss Sparkline")
For i = 2 To 14 - 1
FpSpread1_Sheet1.SetValue(i, 0, New DateTime(2019, i - 1, 1))
Next
FpSpread1_Sheet1.SetValue(2, 1, 10)
FpSpread1_Sheet1.SetValue(3, 1, 20)
FpSpread1_Sheet1.SetValue(4, 1, 50)
FpSpread1_Sheet1.SetValue(5, 1, 100)
FpSpread1_Sheet1.SetValue(6, 1, 30)
FpSpread1_Sheet1.SetValue(7, 1, -10)
FpSpread1_Sheet1.SetValue(8, 1, -25)
FpSpread1_Sheet1.SetValue(9, 1, 60)
FpSpread1_Sheet1.SetValue(10, 1, 50)
FpSpread1_Sheet1.SetValue(11, 1, 30)
FpSpread1_Sheet1.SetValue(12, 1, 80)
FpSpread1_Sheet1.SetValue(13, 1, 88)
'Add span cells
FpSpread1_Sheet1.AddSpanCell(2, 2, 12, 1)
FpSpread1_Sheet1.AddSpanCell(2, 3, 12, 1)
FpSpread1_Sheet1.AddSpanCell(2, 4, 12, 1)
'Set sparkline formulas
worksheet.Cells(2, 2).Formula = "LINESPARKLINE(B3:B14,0,A3:A14,0,{""ac"",""orange"";""fmc"",""brown"";""highMarkerColor"",""red"";""lastMarkerColor"",""blue"";""lowMarkerColor"",""green"";""markersColor"",""purple"";""negativeColor"",""yellowgreen"";""seriesColor"",""pink"";""displayXAxis"",true;""showFirst"",""true"";""showHigh"",""true"";""showLast"",""true"";""showLow"",""true"";""showNegative"",""true"";""showMarkers"",""true"";""lineWeight"",""1"";""displayHidden"",""false"";""DISPLAYBLANKSAS"",""Interpolated"";""rightToLeft"",""false"";""minAxisType"",""Single"";""maxAxisType"",""Custom"";""manualMax"",""100"";""manualMin"",""-1""})";
worksheet.Cells(2, 3).Formula = "COLUMNSPARKLINE(B3:B14,0,A3:A14,0,{""AXISCOLOR"",""pink"";""firstMarkerColor"",""brown"";""highMarkerColor"",""red"";""lastMarkerColor"",""blue"";""lowMarkerColor"",""green"";""markersColor"",""purple"";""negativeColor"",""yellowgreen"";""seriesColor"",""pink"";""displayXAxis"",true;""showFirst"",""true"";""showHigh"",""true"";""showLast"",""true"";""showLow"",""true"";""showNegative"",""true"";""showMarkers"",""true"";""lineWeight"",""1"";""displayHidden"",""false"";""DISPLAYBLANKSAS"",""Interpolated"";""rightToLeft"",""false"";""minAxisType"",""Single"";""maxAxisType"",""Custom"";""manualMax"",""100"";""manualMin"",""-1""})";
worksheet.Cells(2, 4).Formula = "WINLOSSSPARKLINE(B3:B14,0,A3:A14,0,{""axisColor"",""orange"";""firstMarkerColor"",""blue"";""highMarkerColor"",""blue"";""lastMarkerColor"",""blue"";""lowMarkerColor"",""blue"";""markersColor"",""blue"";""negativeColor"",""blue"";""seriesColor"",""blue"";""displayXAxis"",true;""showFirst"",""true"";""showHigh"",""true"";""showLast"",""true"";""showLow"",""true"";""showNegative"",""true"";""showMarkers"",""true"";""lineWeight"",""1"";""displayHidden"",""false"";""DISPLAYBLANKSAS"",""Interpolated"";""rightToLeft"",""false"";""minAxisType"",""Single"";""maxAxisType"",""Custom"";""manualMax"",""100"";""manualMin"",""-1""})";
'Set backcolor for cells
worksheet.Cells("A1").Interior.Color = GrapeCity.Spreadsheet.Color.FromArgb(&HFFB39A9A)
worksheet.Cells("A2:E2").Interior.Color = GrapeCity.Spreadsheet.Color.FromArgb(&HFFF5E4E4)
worksheet.Cells("A3:E14").Interior.Color = GrapeCity.Spreadsheet.Color.FromArgb(&HFFF9F9F9)
```
## Using the Spread Designer
1. Type data in a cell or a column or row of cells in the designer.
2. Select a cell for the sparkline.
3. Select the Insert menu.
4. Select a sparkline type.
5. Set the Data Range in the **Create Sparklines** dialog (such as =Sheet1!$E$1:$E$3).
Alternatively, set the range by selecting the cells in the range using the pointer.
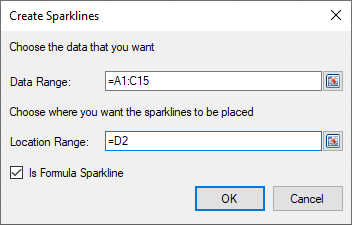
You can also set additional sparkline settings in the dialog if available.
6. Select OK.
7. Select Apply and Exit from the File menu to save your changes and close the designer.