# Pivot Table Context Menu
## Content
Spread Winforms Designer provides different context menu options while accessing different areas of a pivot table. These options allow you to quickly execute the common or repetitive operations in the pivot table.
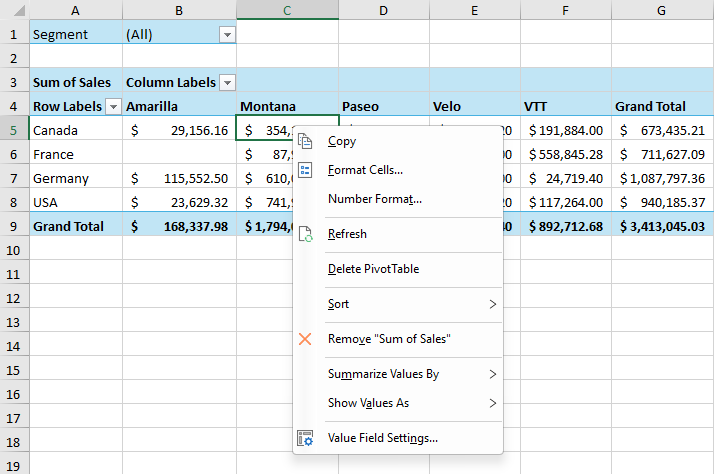
The following table shows common context menu options in a pivot table.
| **Options** | **Description** |
| ------- | ----------- |
| Copy | Copy the contents of the selected cell(s) to the clipboard. |
| Format Cells | Open the **Format Cells** dialog to change number, date, alignment, font, border, fill, or protection settings. |
| Number Format | Change the appearance of the numbers in the selected field, such as setting them as currency, percentage, or with a specific number of decimal places. |
| Refresh | Update the pivot table to reflect any changes in the source data. |
| Delete PivotTable | Delete the entire pivot table from the worksheet. |
| Sort | Sort the selected field in ascending or descending order. Options include Sort **Smallest to Largest**, **Largest to Smallest**, and custom sorting options. |
| Filter | Filter the field data by applying **Label Filters**, **Value Filters**, or other filter options. |
| Subtotal "FieldName" | Show or hide subtotals for this field. |
| Expand/Collapse | Expand or collapse grouped items to show or hide details. |
| Group | Groups selected PivotTable field values to analyze subsets. |
| Ungroup | Remove grouping from selected items and restore original detail. |
| Remove "FieldName" | Remove the selected field (for example, "Segment") from the pivot table. |
| Summarize Values By | Choose how to summarize values, such as Sum, Count, Average, Max, or Min, etc. |
| Show Values As | Display values as a percentage of total, running total, or use other calculation methods. |
| Field Settings | The dialog allows you to set how a field is summarized and displayed in a pivot table, including subtotal methods, filter options and layout options. For detailed information, please refer to [Field Settings and Value Field Settings](/spreadnet/docs/latest/online-win/overview/spwin-designerguide/using-the-pivot-table-designer/field-settings-and-value-field-settings). |
| Value Field Settings | The dialog allows you to change the summary function used to calculate values in the PivotTable (such as Sum, Count, Average, Min, Max, and more). You can also rename the field and format the displayed values. Use the **Summarize Values By** tab to select the calculation type, or use the **Show Values As** tab to display values as a percentage or other calculation. For detailed information, please refer to [Field Settings and Value Field Settings](/spreadnet/docs/latest/online-win/overview/spwin-designerguide/using-the-pivot-table-designer/field-settings-and-value-field-settings). |
| PivotTable Options | The dialog allows you to customize layout, formatting, and advanced settings. For detailed information, please refer to [Pivot Table Options](/spreadnet/docs/latest/online-win/overview/spwin-designerguide/using-the-pivot-table-designer/pivot-table-options). |
## Group
Groups the selected data in the PivotTable to show a subset of data for analysis. Right-click on a value in a row field or column field and select **Group** from the context menu. The behavior varies based on the field value type:
### Numeric Values
* When a single cell is selected, the Grouping dialog appears. After editing the **Starting at** or **Ending at** values, their corresponding checkboxes are automatically unchecked.
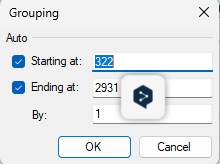
* **Starting at** \- Specify the start value for the grouping range \(optional\)
* **Ending at** \- Specify the end value for the grouping range \(optional\)
* **By** \- Set the interval size for numeric grouping \(must be greater than 0\)
* When a range of numeric values is selected, the values are grouped automatically using the detected range. The **Grouping** dialog does not appear.
### Date Values
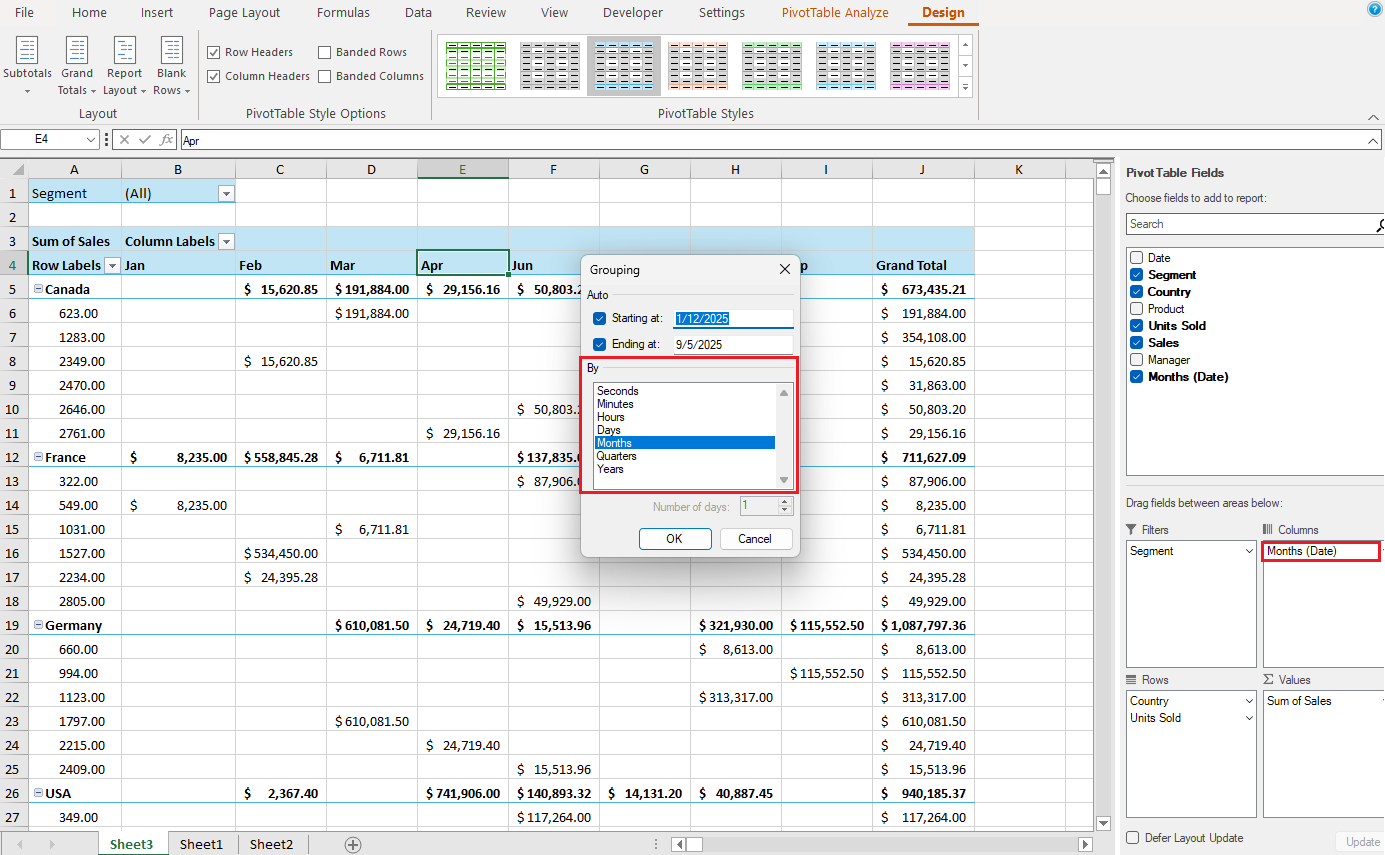
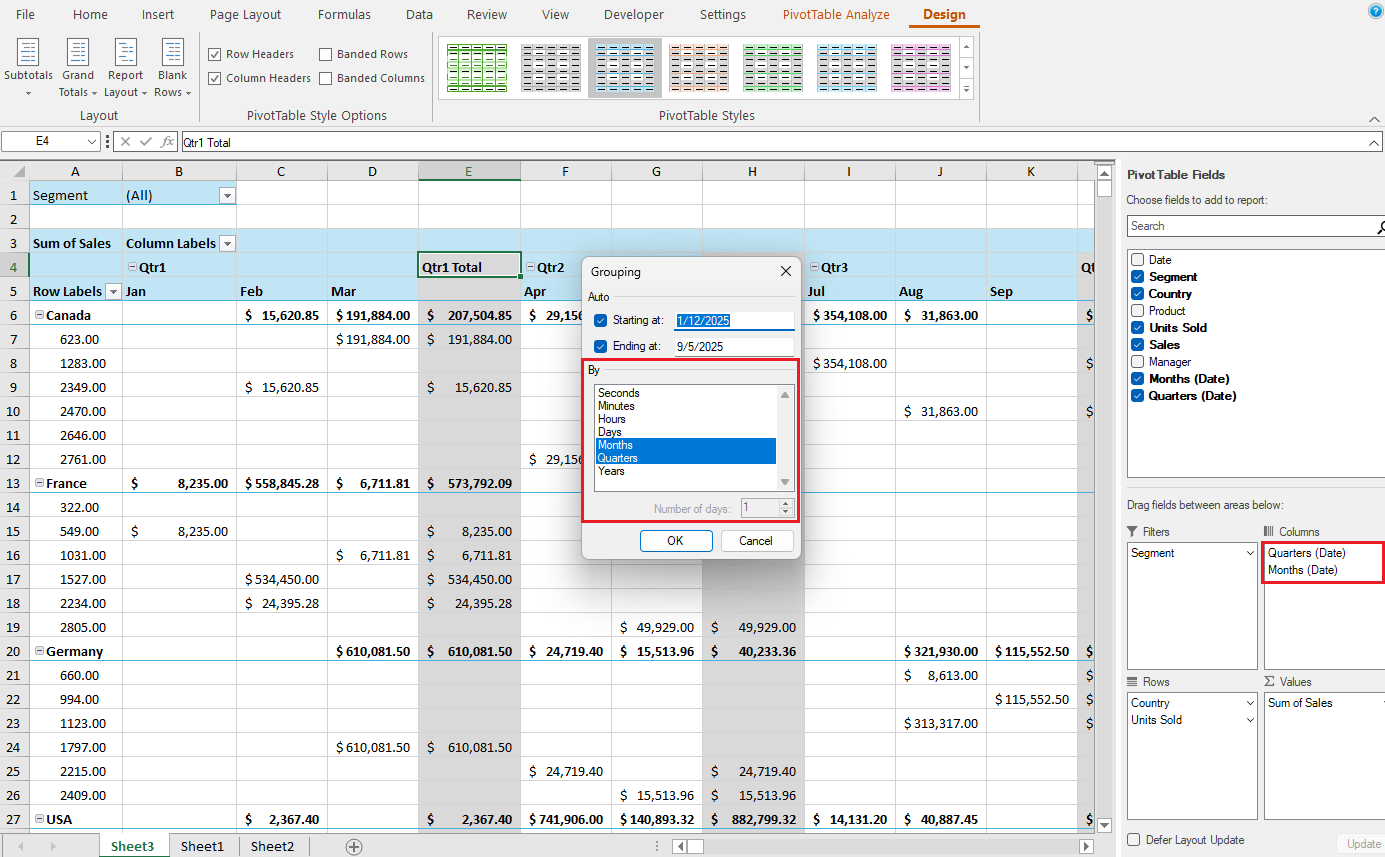
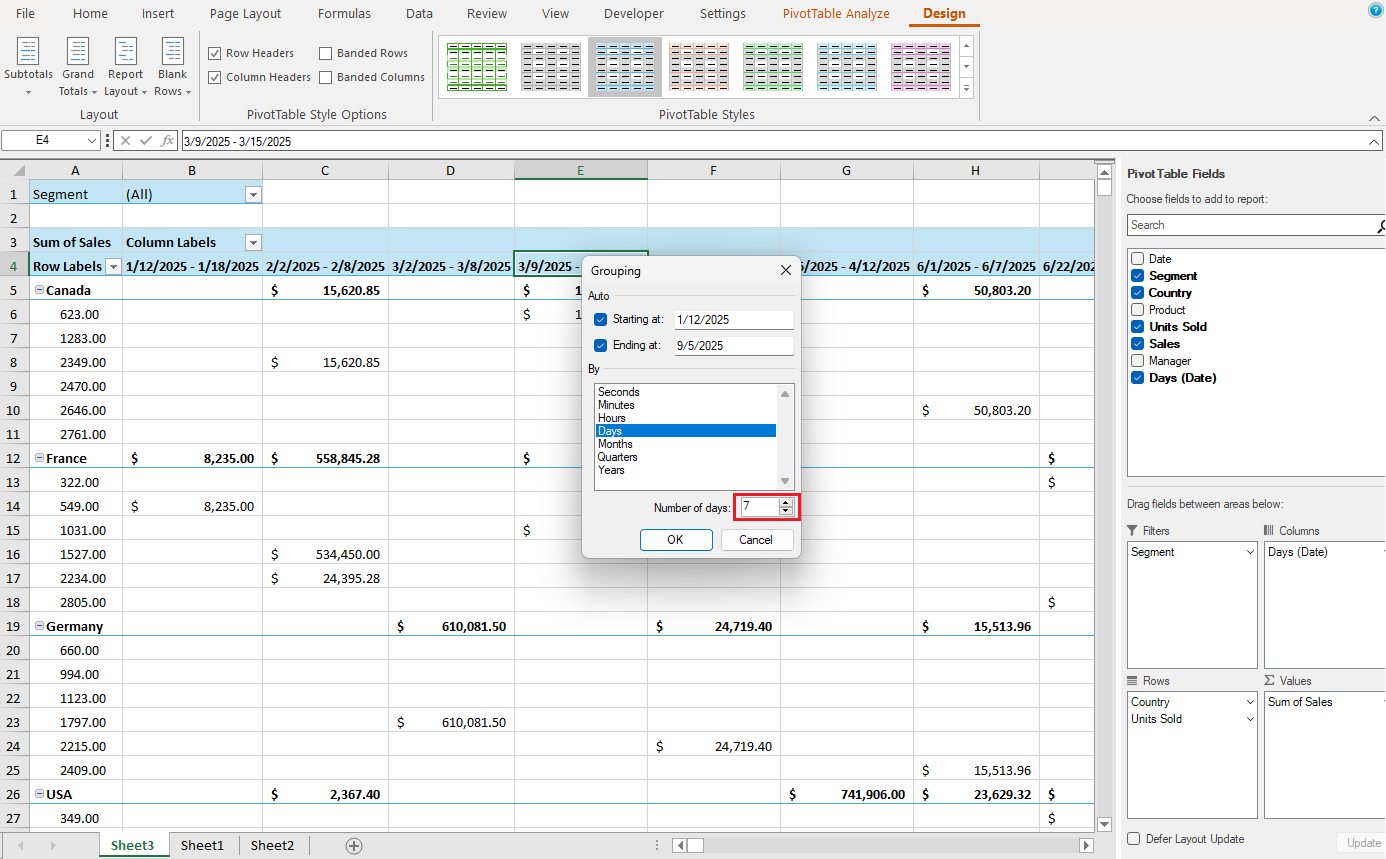
You can group data by common intervals—such as seconds, minutes, hours, days, months, quarters, or years—and you can also define custom ranges, like a 7‑day interval (for a weekly view) or any other span that fits your scenario. The selected periods add corresponding fields to the PivotTable row/column areas.
**Select a single period**
**Select multiple periods**
**Custom period (for example, using a 7-day interval)**
### Text Values
* When a single cell containing a text value is selected, a warning message appears indicating that grouping cannot be performed on individual text values.
* When a range containing text values is selected, the selected text values are grouped automatically without displaying a dialog.