# FORECAST.ETS.STAT
Spread for WinForms provides advanced software components that support Excel import/export, full cell customization, an extensive calculation engine with over 450 functions and more, all with zero dependencies on Excel.
## Content
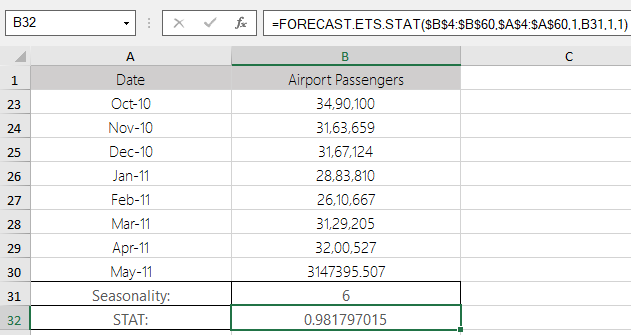
This function return a statistical value as a result of time series forecasting. Statistic type indicates which statistic is requested by this function.
## Syntax
=FORECAST.ETS.STAT(values,timeline,statistic\_type,[seasonality],[data\_completion],[aggregation])
## Arguments
The function has the following arguments:
| **Argument** | **Description** |
| -------- | ----------- |
| *values* | [Required] is a range of the historical values for which you want to predict a new point. |
| *timeline* | [Required] is a range of date/time values that correspond to the historical values. The timeline range must be of the same size as the values range. Date/time values must have a constant step between them. |
| *statistic\_type* | [Required] A numeric value between 1 and 8, indicating which statistic will be returned for the calculated forecast. The table below shows the eight possible statistical values and their corresponding results. |
| *seasonality* | [Optional] is a numeric value that specifies which method should be used to detect the seasonality. The possible values are listed below. |
| *data\_completion* | [Optional] is a numeric value that specifies how to process the missing data points in the timeline data range. The possible values are:
**1 or omitted**: Missing points are calculated as the average of the neighboring points.
**0:** Missing points are treated as zero values. |
| *aggregation* | [Optional] is a numeric value that specifies which function should be used to aggregate identical time values in the timeline data range. The possible values are listed below. |
### Statistic types
| Value | Statistic type | Description |
| ----- | -------------- | ----------- |
| 1 | Alpha | It is the base parameter of ETS algorithm. Higher values indicate more weight to recent data. |
| 2 | Beta | It is the trend parameter of ETS algorithm. Higher values indicate more weight to recent trends. |
| 3 | Gamma | It is the seasonality parameter of ETS algorithm. Higher values indicate more weight to recent seasonal periods. |
| 4 | MASE | It stands for Mean Absolute Scaled Error metric, a measure of forecast accuracy. |
| 5 | SMAPE | It stands for Symmetric Mean Absolute Percentage Error metric, an accuracy measure based on percentage errors. |
| 6 | MAE | It stands for the Mean Absolute percentage Error metric, a measure of accuracy based on percentage errors. |
| 7 | RMSE | It stands for Root Mean Squared Error metric, a measure of differences between predicted and observed values. |
| 8 | Step Size | It is detected in the historical data timeline. |
### Seasonality
* **1 or omitted**: Seasonality is detected automatically. Positive, whole numbers are used for the length of the seasonal pattern.
* **0:** No seasonality, the prediction will be linear.
* **An integer greater than or equal to 2:** The specified number is used for the length of the seasonal pattern.
### Aggregation values
| **Value** | **Description** |
| ----- | ----------- |
| 1 or omitted | AVERAGE |
| 2 | COUNT |
| 3 | COUNTA |
| 4 | MAX |
| 5 | MEDIAN |
| 6 | MIN |
| 7 | SUM |
## Data Types
Returns a specified statistical value relating to a time series.
## Examples
## Version Available
This function is available in product version 16.0 or later.