# Histogram Charts
Spread for ASP.NET allows you to add a Histogram chart in your spreadsheet to show the frequency of data.
## Content
A histogram chart shows the frequency of data. The chart uses two types of data (data to be analyzed and the bin numbers that represent the frequency intervals of the data).
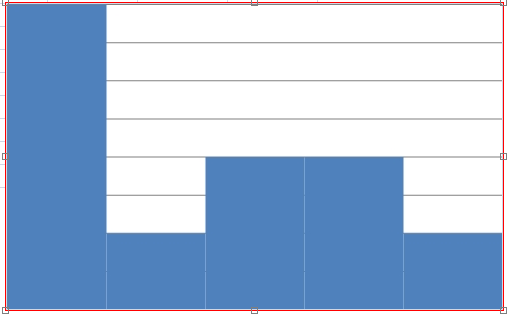
You can specify the following options for the chart:
| **Properties** | **Description** |
| ---------- | ----------- |
| [AutoUnderFlow](/spreadnet/api/latest/online-asp/FarPoint.Web.Chart/FarPoint.Web.Chart.BinOption.AutoUnderFlow.html)
[AutoOverFlow](/spreadnet/api/latest/online-asp/FarPoint.Web.Chart/FarPoint.Web.Chart.BinOption.AutoOverFlow.html) | Specifies that the bin width is calculated using Scott’s normal reference rule. Scott’s normal reference rule tries to minimize the bias in variance of the histogram compared with the data set, while assuming normally distributed data. |
| [BinCount](/spreadnet/api/latest/online-asp/FarPoint.Web.Chart/FarPoint.Web.Chart.BinOption.BinCount.html) | Specifies the number of bins for the histogram (including overflow and underflow bins). |
| [OverFlowValue](/spreadnet/api/latest/online-asp/FarPoint.Web.Chart/FarPoint.Web.Chart.BinOption.OverFlowValue.html)
[IsOverflowBin](/spreadnet/api/latest/online-asp/FarPoint.Web.Chart/FarPoint.Web.Chart.BinOption.IsOverflowBin.html) | Creates a bin for all values above the specified value. |
| [IsUnderflowBin](/spreadnet/api/latest/online-asp/FarPoint.Web.Chart/FarPoint.Web.Chart.BinOption.IsUnderflowBin.html)
[UnderFlowValue](/spreadnet/api/latest/online-asp/FarPoint.Web.Chart/FarPoint.Web.Chart.BinOption.UnderFlowValue.html) | Creates a bin for all values below or equal to the specified value. |
| [BinType](/spreadnet/api/latest/online-asp/FarPoint.Web.Chart/FarPoint.Web.Chart.BinOption.BinType.html) | Specifies whether to use categories or numbers for the bins. |
You can add data to the control or use the [HistogramSeries](/spreadnet/api/latest/online-asp/FarPoint.Web.Chart/FarPoint.Web.Chart.HistogramSeries.html) class to create data for the chart. Use the [BinSize](/spreadnet/api/latest/online-asp/FarPoint.Web.Chart/FarPoint.Web.Chart.BinOption.BinSize.html) property to specify the bin size.
For information about creating charts in the Spread Designer or the Chart Designer, refer to [Using the Spread Designer](/spreadnet/docs/latest/online-asp/overview/spweb-devguide/spweb-chart/spweb-chartcreate/spweb-chartsd) or [Using the Chart Designer](/spreadnet/docs/latest/online-asp/overview/spweb-devguide/spweb-chart/spweb-chartcreate/spweb-chartdesigner).
## Using Code
1. Add data for the chart with the [HistogramSeries](/spreadnet/api/latest/online-asp/FarPoint.Web.Chart/FarPoint.Web.Chart.HistogramSeries.html) class.
2. Set the bin size.
3. Specify the plot area.
4. Add the chart.
## Example
This example creates a histogram chart with a bin size of 20.
```csharp
FarPoint.Web.Chart.HistogramSeries hs = new FarPoint.Web.Chart.HistogramSeries();
hs.SeriesName = "Histogram Sample";
hs.Values.Add(23);
hs.Values.Add(5);
hs.Values.Add(79);
hs.Values.Add(11);
hs.Values.Add(23);
hs.Values.Add(55);
hs.Values.Add(88);
hs.Values.Add(67);
hs.Values.Add(42);
hs.Values.Add(56);
hs.BinOption.BinSize = 20;
FarPoint.Web.Chart.YPlotArea plotArea = new FarPoint.Web.Chart.YPlotArea();
plotArea.Series.Add(hs);
FarPoint.Web.Chart.ChartModel model = new FarPoint.Web.Chart.ChartModel();
model.PlotAreas.Add(plotArea);
FarPoint.Web.Spread.Chart.SpreadChart chart = new FarPoint.Web.Spread.Chart.SpreadChart();
chart.Model = model;
FpSpread1.ActiveSheetView.Charts.Add(chart);
```
```vbnet
Dim hs As New FarPoint.Web.Chart.HistogramSeries()
hs.SeriesName = "Histogram Sample"
hs.Values.Add(23)
hs.Values.Add(5)
hs.Values.Add(79)
hs.Values.Add(11)
hs.Values.Add(23)
hs.Values.Add(55)
hs.Values.Add(88)
hs.Values.Add(67)
hs.Values.Add(42)
hs.Values.Add(56)
hs.BinOption.BinSize = 20
Dim plotArea As New FarPoint.Web.Chart.YPlotArea()
plotArea.Series.Add(hs)
Dim model As New FarPoint.Web.Chart.ChartModel()
model.PlotAreas.Add(plotArea)
Dim chart As New FarPoint.Web.Spread.Chart.SpreadChart()
chart.Model = model
FpSpread1.ActiveSheetView.Charts.Add(chart)
```
## See Also
[BinOption Class](/spreadnet/api/latest/online-asp/FarPoint.Web.Chart/FarPoint.Web.Chart.BinOption.html)