# Combo Chart Settings
## Content
The Combo Chart provides a flexible visualization tool that combines multiple chart types (e.g., column, line, area) into a single, unified chart. This allows users to represent and compare different types of data—such as quantities, trends, or percentages—within one graphical display.
## Create a Combo Chart in Designer
Users can initiate **combo chart** creation by first creating a base data chart. The toggle for combo chart creation is displayed in both **Inspector** or **Data Binding** panels.
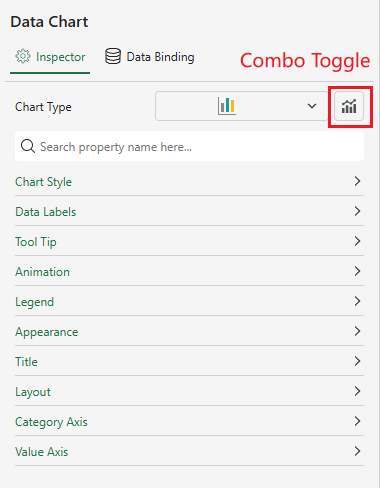
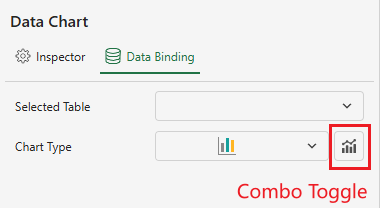
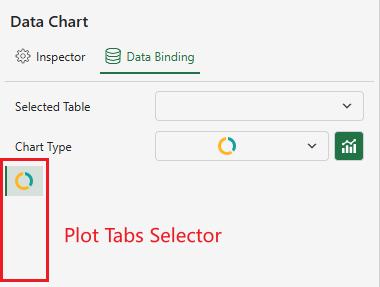
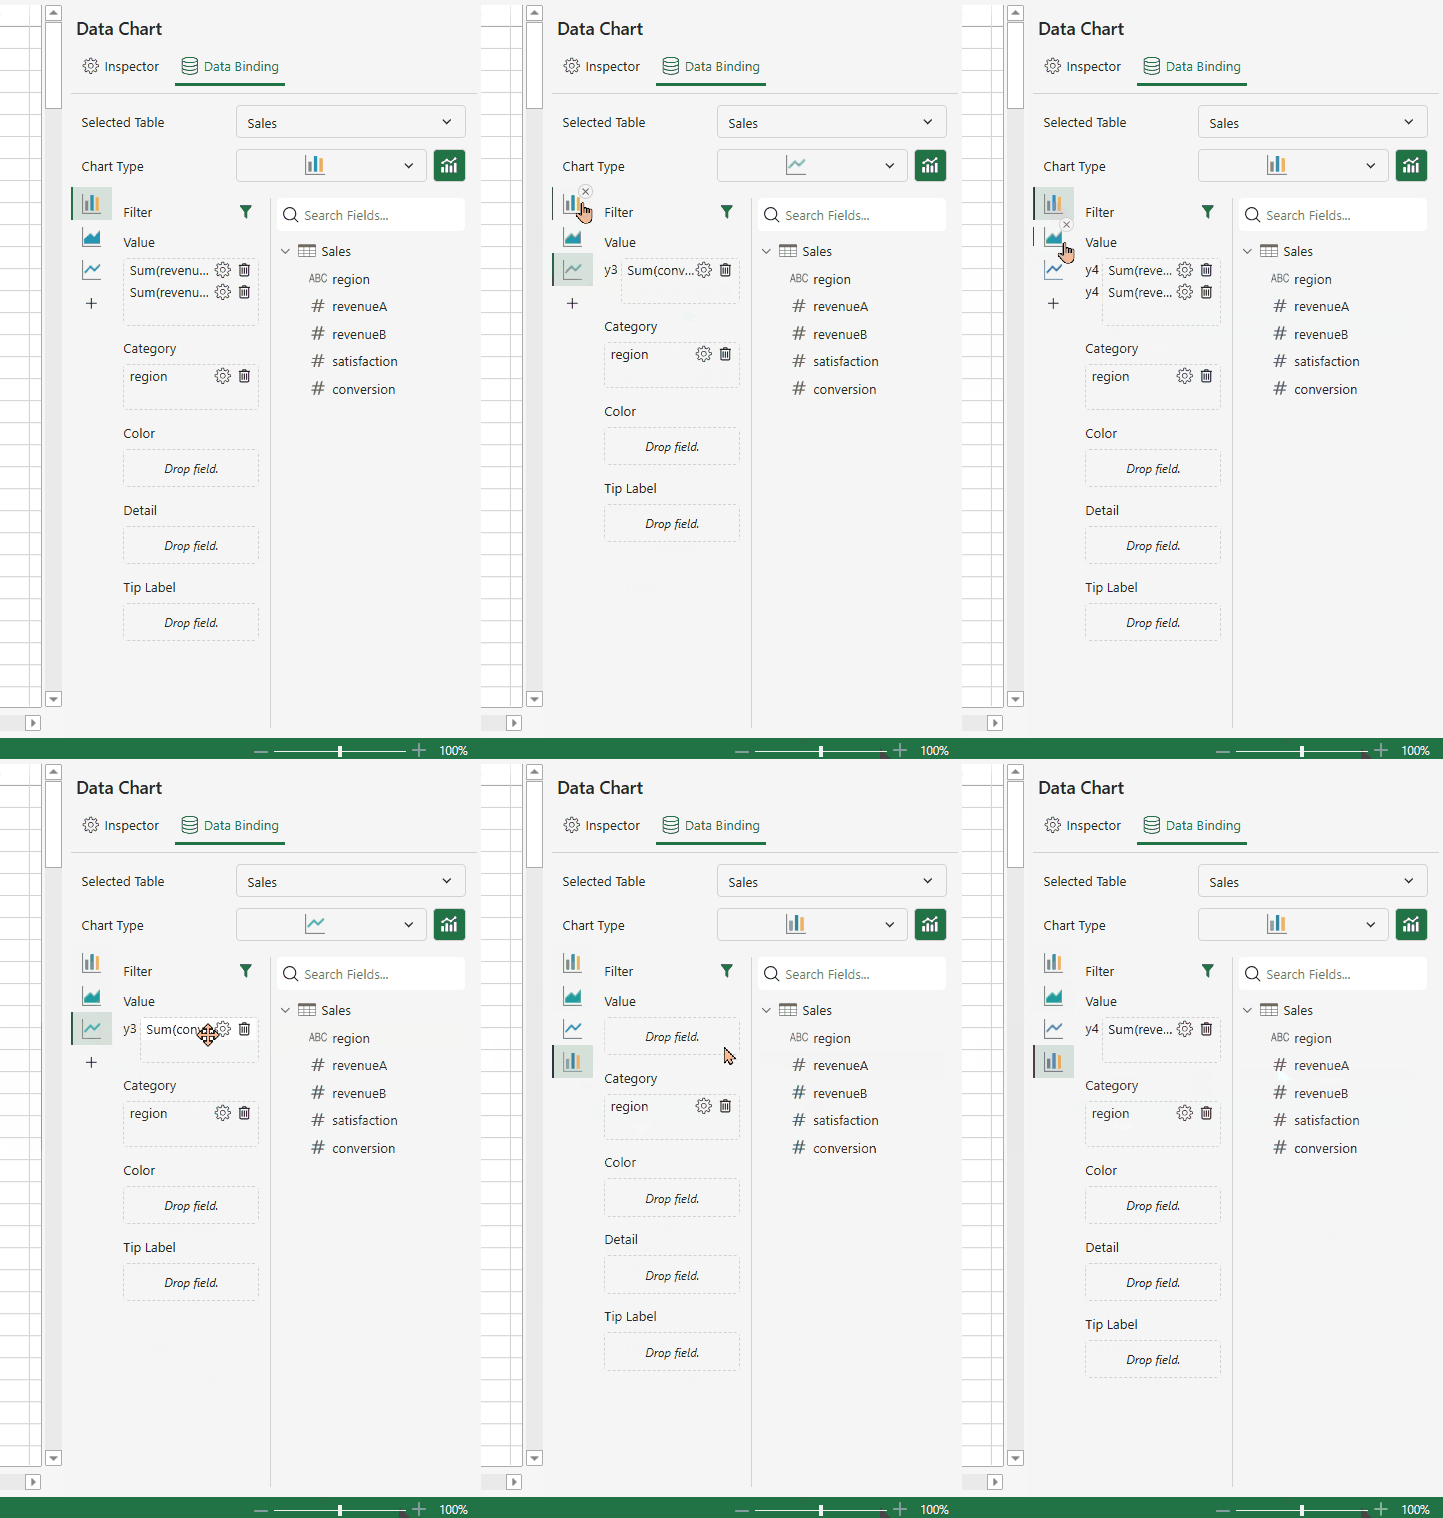
When you turn on the Combo toggle, a tab list is added to the left side of the Panel.
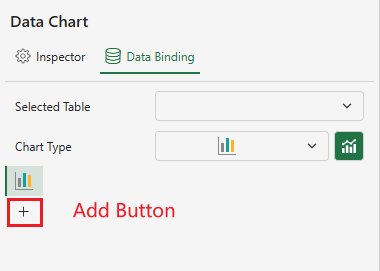
If the current data chart type supports combo charts, a “**+**” button (for adding a new plot) appears under the active tab.
>type=note
> **Notes:**
>
> * The following chart types support combo chart configuration: **Column**, **Area**, **Line**, **Candlestick**, **OHLC**, **Bar**, **Radar**, **Scatter**。
> * Some chart variations (for example, *Range Column, Stacked Column and Percent Stacked Column*) follow the same combination rules.
> * **Up to 4 tabs** are supported.
> * When the maximum number of tabs (4) is reached, the “**+**” button is automatically hidden.
> * For implementation details, refer to the documentation: Combo Chart.
After clicking the “**+**” button, a matrix of compatible chart types is displayed. Unsupported types are grayed out.
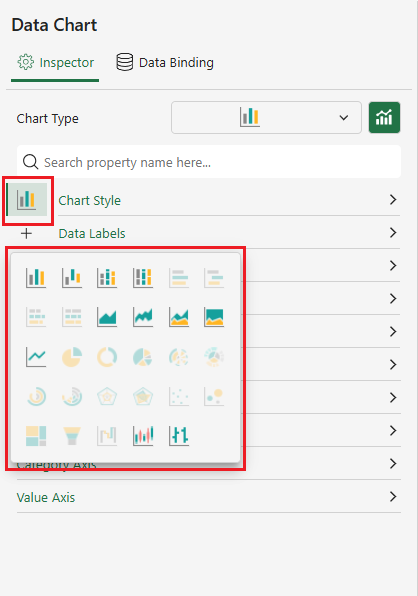
Each subplot can be configured independently by selecting the corresponding tab from the left column.
Selecting a tab switches the view to the configuration panel for that subplot.
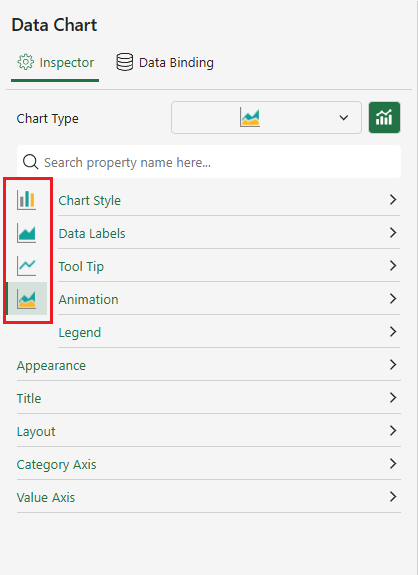
All plots in a Combo Chart share the **same settings** for **Category Axis**, **Appearance**, **Title**, and **Layout** configurations of the primary chart. Modifying any of these settings will **automatically synchronize** updates across all subplots.
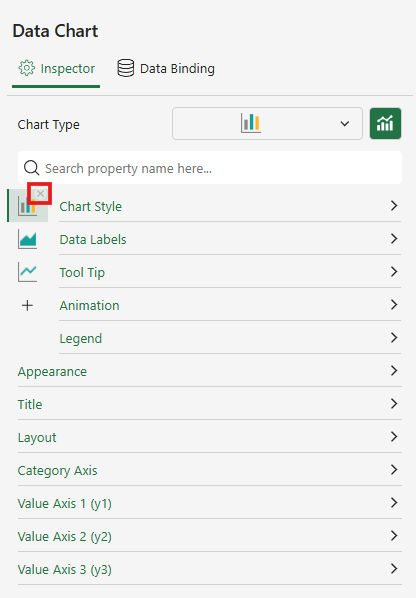
When you want to delete a plot, click the close button at the top right corner of the corresponding tab.
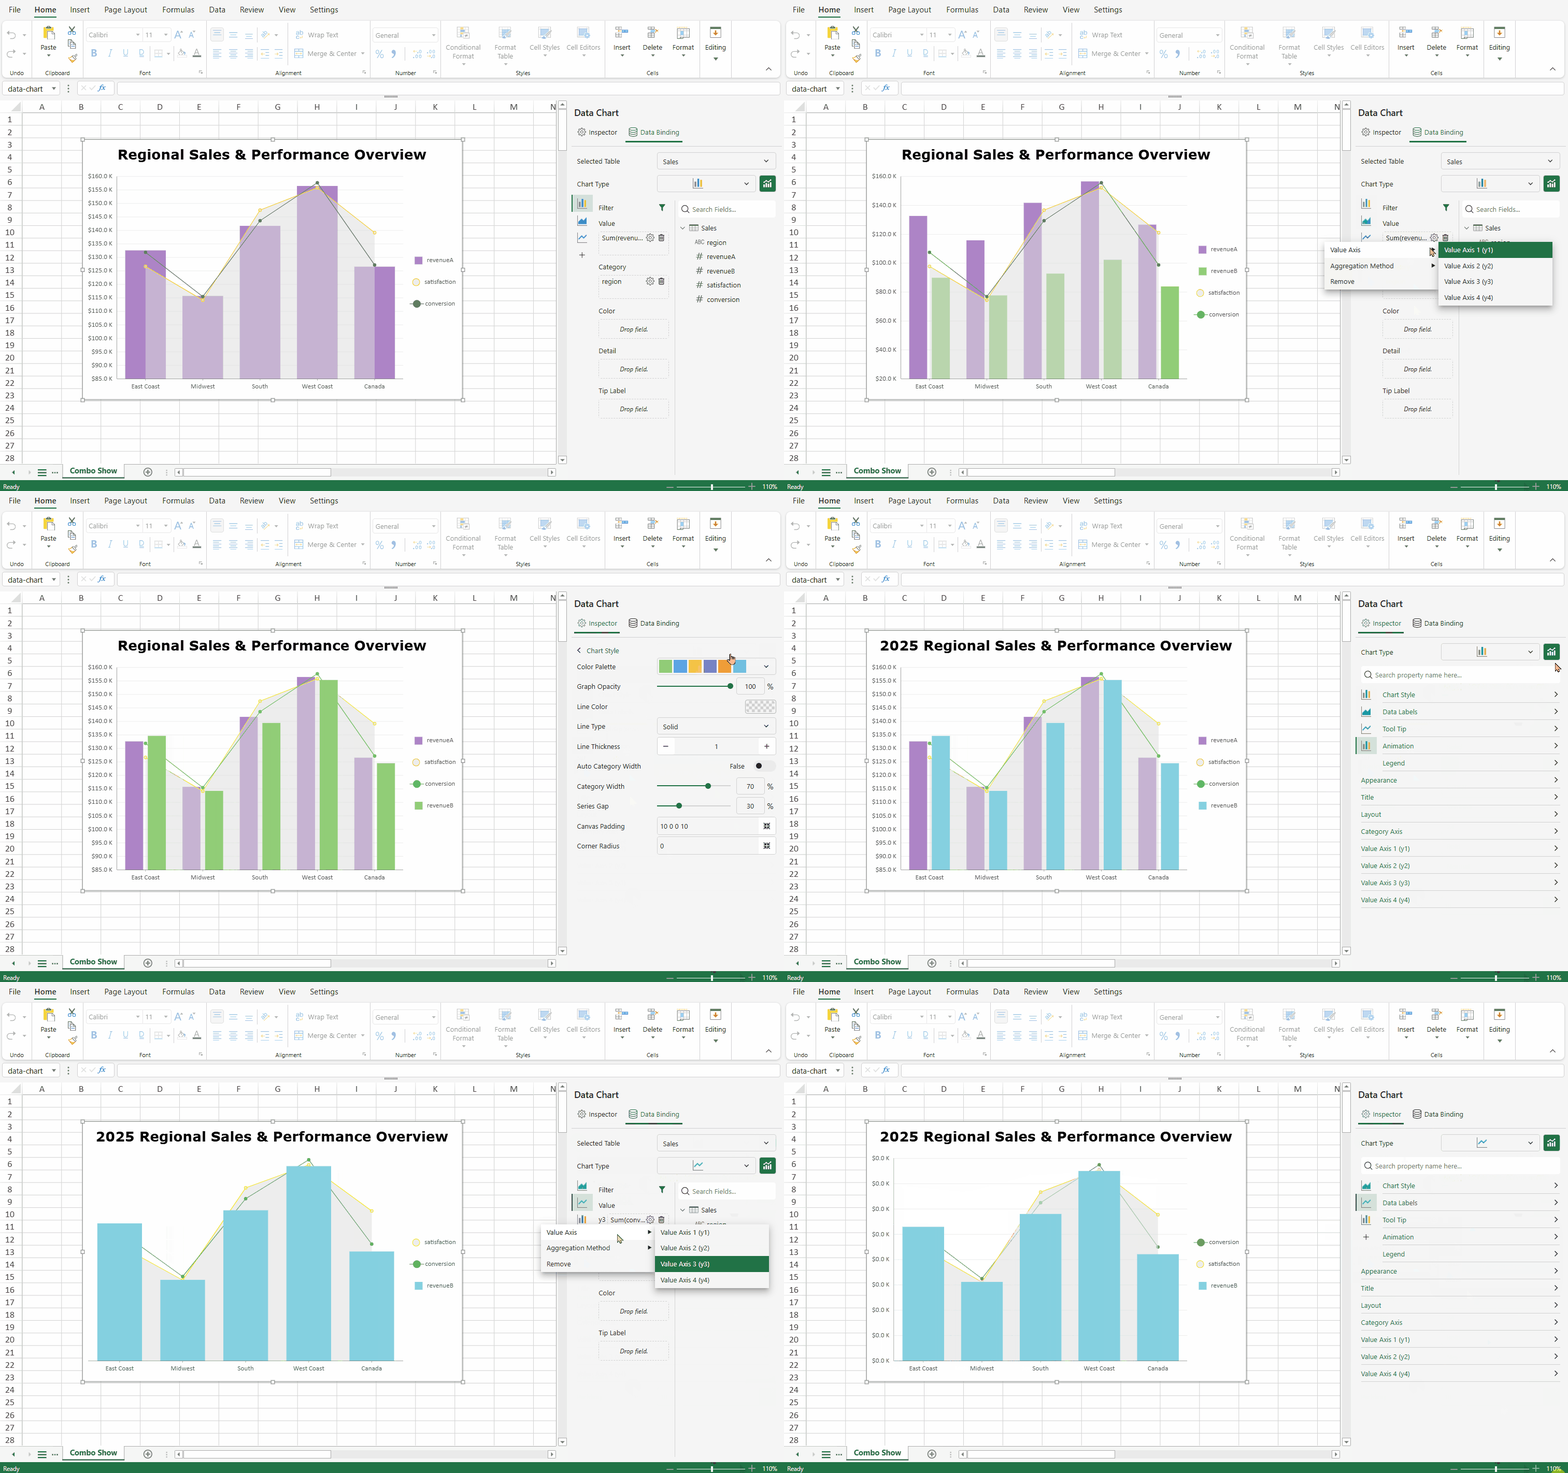
Below is a interactive demo:
## Work with Multiple Y‑Axes
A combo chart supports multiple value axes, allowing plots with different value ranges to be displayed within the same chart.
**Value** **Axis Binding**
To bind a value to a specific value axis:
1. In the **Data Binding** panel, select the value field you want to configure.
2. Click the **gear icon** next to it, and choose **Value Axis**.
3. Hover over the **Value Axis** option to display a list of existing value axes.
4. Select the desired axis to bind the current value field to that axis.
The following rules apply to axis binding:
* Each plot must be bound to at least one value axis.
* Up to four value axes (**Y1–Y4**) are available.
* By default, all value fields are bound to a common axis (**Y1**).
* A value field’s Y‑axis binding can be switched to another axis.
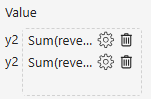
When a value field is assigned to **Y2–Y4**, the Data Binding panel automatically prefixes the field with the axis label (e.g., “y3”) to indicate its binding.
**Value** **Axis Customization**
Each Y‑axis can be configured independently. Users can modify its scale, style, and properties through the configuration panel.
**Dynamic Value** **Axis Display in the Inspector Panel**
The **Inspector** panel **dynamically generates separate Y‑Axis Settings panels** based on the number of active value axes. These panels allows users to configure each axis independently.
| **Binding Scenario** | **Inspector Panel Display** | **UI Example** |
| ---------------- | ----------------------- | ---------- |
| Single Y‑axis
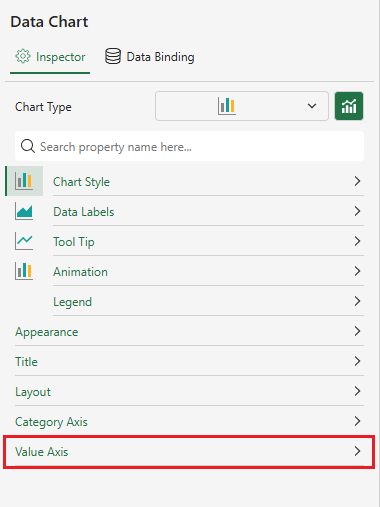
-Bound to Y1 | For a single Y‑axis, one Value Axis panel is displayed.- When bound to Y1, the axis label is hidden
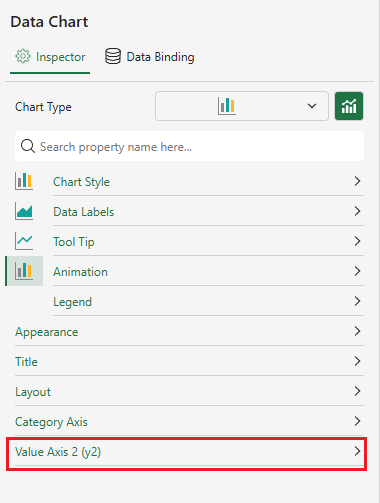
- When bound to Y2–Y4, the label (e.g. “y3”) appears after the panel name.
| 
 |
| Multiple Y‑axes | A separate configuration panel is dynamically generated for each active Y‑axis. | 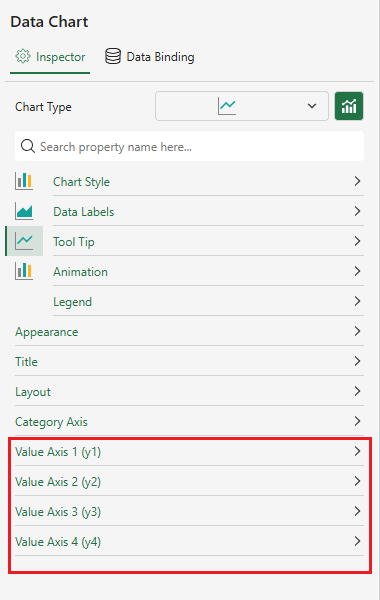 |
The following rules apply to axis binding:
* A Y‑axis panel appears only when at least one value field is bound to that axis.
* Unused axes remain hidden automatically from both the chart and the Inspector panel.
* When only **Y1** is used, the “Y1” label is omitted by default.
* Panels are listed in descending order (**Y1 → Y4**) within the **Inspector** panel.