# Bind Data Source
This topic explains how to bind data from the data source in Data Charts.
## Content
A Data Chart must be connected to a data source before it can visualize data. In SpreadJS, data is typically managed through the Data Manager, where tables are defined and maintained.
To display data in a Data Chart, you:
1. Bind the chart to a table.
2. Map table fields to chart encodings.
This topic explains how to configure data binding and how encodings control data visualization.
## Bind a Chart to a Table
Each Data Chart binds to a table by setting the `tableName` property in the chart configuration.
```javascript
dataChart.setChartConfig({
tableName: 'Sales',
plots: [...]
});
```
The table must exist in the Data Manager.
Data Charts can also bind data from multiple related tables. When using multiple tables:
* Relationships must be defined in the Data Manager.
* Fields from related tables can be referenced using `tableName.fieldName`.
## Encodings
Encodings define how data fields are mapped to visual elements in the chart.
Each plot defines its encodings under:
```javascript
plots[n].encodings
```
Encodings control:
* What values are aggregated
* How data is grouped
* How colors, tooltips, and filters are applied
Encodings are organized into:
* Value Encoding
* Category Encoding
* Other Encodings
### Value Encoding
Value encoding defines which numeric fields are visualized as measures (typically along the Y-axis).
#### Single-Field Value Encoding
The most common scenario binds one field per value entry:
```javascript
encodings: {
values: [
{
field: "Sales",
aggregate: GC.Spread.Sheets.DataCharts.Aggregate.sum
}
]
}
```
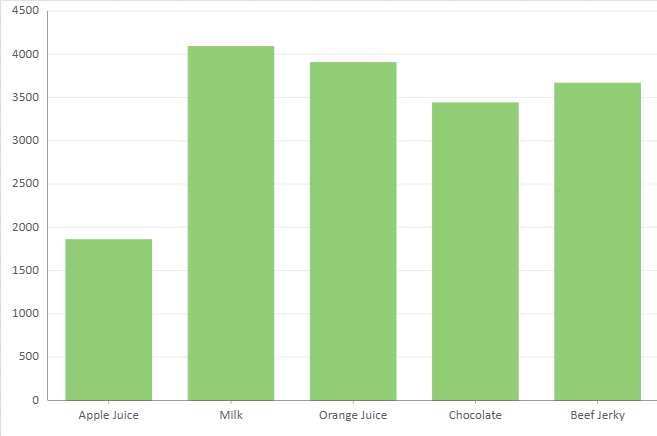
When multiple value fields are defined:
* Each field is treated as a separate series.
* The legend is automatically generated from the value fields.
Some chart types (such as Pie and Donut) support only a single value field.
#### Multi-Field Value Encoding
**Supported chart types**
* Range value encoding:
* Range Column
* Range Bar
* Range Area
* Stock value encoding:
* Candlestick
* OHLC
Some chart types require multiple data fields to represent a single logical value.
Examples:
* Range charts require lower and upper values.
* Candlestick and OHLC charts require open, high, low, and close values.
For these charts, multiple fields are grouped under a single value entry using a `vectors` structure.
**Range Chart Example**
```javascript
encodings: {
values: [{
vectors: {
lower: { field: "Return" },
upper: { field: "Sales" }
},
aggregate: GC.Spread.Sheets.DataCharts.Aggregate.sum
}],
category: { field: "Product" }
}
```
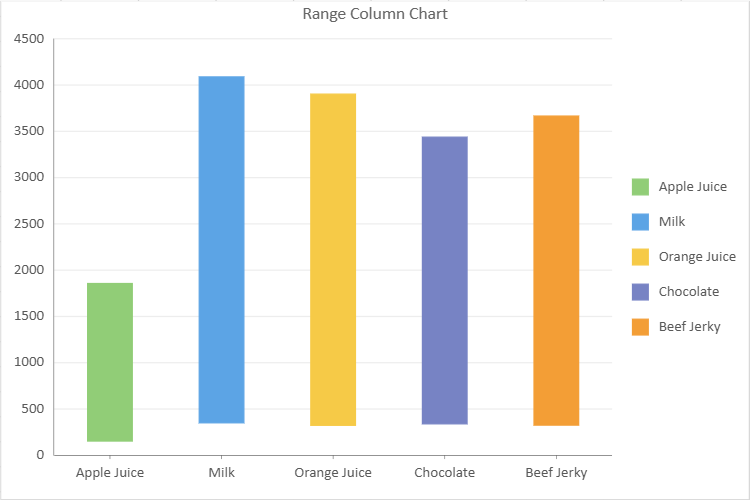
**Stock Chart Example**
```javascript
encodings: {
values: [{
vectors: {
open: { field: "open" },
high: { field: "high" },
low: { field: "low" },
close: { field: "close" }
}
}],
category: { field: "date" }
}
```
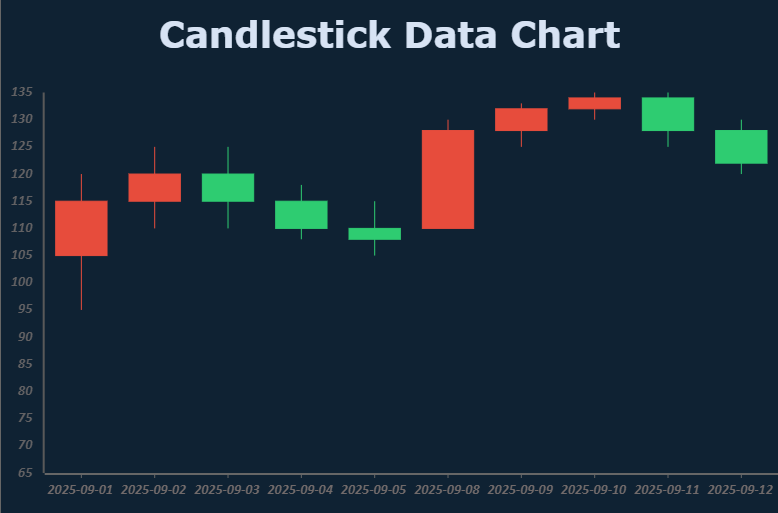
In this structure:
* Each named vector binds to a specific field.
* All required vectors must be provided for the chart type.
Existing configurations that use separate value entries continue to work, but the vector structure is recommended for clarity and consistency.
>type=note
> **Note:**
> For chart types that require vectors, all required fields must be provided. If a required vector field is missing, the chart will not render correctly.
### Category Encoding
Category encoding defines how data is grouped along a dimension (typically the X-axis).
#### Flat Category
A flat category binds a single field:
```javascript
encodings: {
category: {
field: "timePeriod"
}
}
```
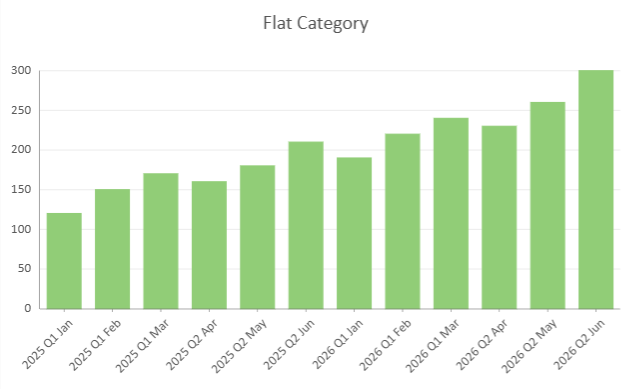
#### Hierarchical Category
Hierarchical Category allows multiple grouping levels within a single plot.
This is useful when working with naturally nested data, such as:
* Year → Quarter → Month
* Region → Country → City
You define hierarchy levels using nested `child` objects.
**Example**
```javascript
encodings: {
values: [{
field: "Sales",
aggregate: GC.Spread.Sheets.DataCharts.Aggregate.sum
}],
category: {
field: "Year",
child: {
field: "Quarter",
child: {
field: "Month"
}
}
}
}
```
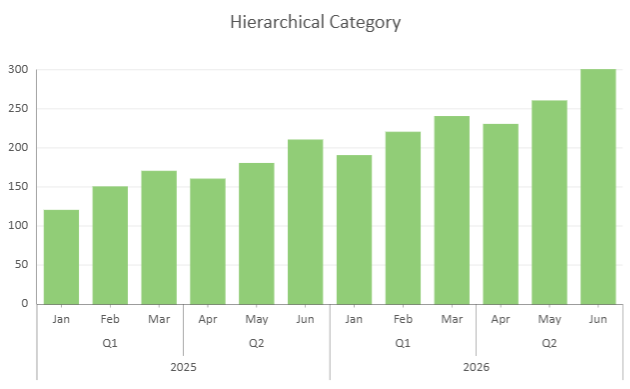
Key characteristics:
* Nesting order defines grouping order.
* Each level refines the grouping of its parent.
* All levels share the same aggregation rules.
* If no `child` is defined, the category behaves as a flat category.
| Supported Chart Types | Unsupported Chart Types |
| --------------------- | ----------------------- |
| - Column
- Range Column
- Stacked Column
- Percent Stacked Column
- Bar
- Range Bar
- Stacked Bar
- Percent Stacked Bar
- Area
- Range Area
- Stacked Area
- Percent Stacked Area
- Line
- Candlestick
- OHLC
| - Pie
- Donut
- Radar
- Polar charts
- Treemap
- Funnel
- Scatter
- Bubble
|
>type=note
> **Note:**
> All hierarchy levels are rendered simultaneously. Hierarchical Category does not provide expand, collapse, or drill-down behavior.
### Other Encodings
* **details** \- Divides data into subgroups within each category\. Most chart types support at most one details field\.
* **color** \- Defines the field used to determine color assignment for plots and legends\.
* **size** \- Applies a continuous size scale\. Supported only by bubble charts\.
* **tooltip** \- Specifies which fields are displayed in tooltips\.
* **filter** \- Applies filtering to source data before aggregation\. Supports numeric and string filtering and nested logical conditions\.
## Using Code
DataCharts bind to tables managed by the SpreadJS Data Manager.
Before configuring a chart, you must:
1. Initialize the Data Manager
2. Register tables
3. (Optional) Define relationships between tables
### Step 1 – Initialize the Data Manager
```javascript
const dataManager = spread.dataManager();
```
### Step 2 – Register Tables
Register all required tables before creating charts.
```javascript
// Sales table
const salesTable = createSalesTable(dataManager);
await salesTable.fetch();
// Orders table
const ordersTable = createOrders(dataManager);
await ordersTable.fetch();
// Order details table
const orderDetailsTable = createOrderDetails(dataManager);
await orderDetailsTable.fetch();
// Hierarchical sales table (used for hierarchical category examples)
const hierarchySalesTable = createHierarchySalesTable(dataManager);
await hierarchySalesTable.fetch();
```
### Step 3 – Define Table Relationships (Optional)
When binding multiple tables, a relationship must be defined between them.
```javascript
dataManager.addRelationship(
ordersTable, "orderId",
"orderDetailsTable",
orderDetailsTable, "OrderId",
"ordersTable"
);
```
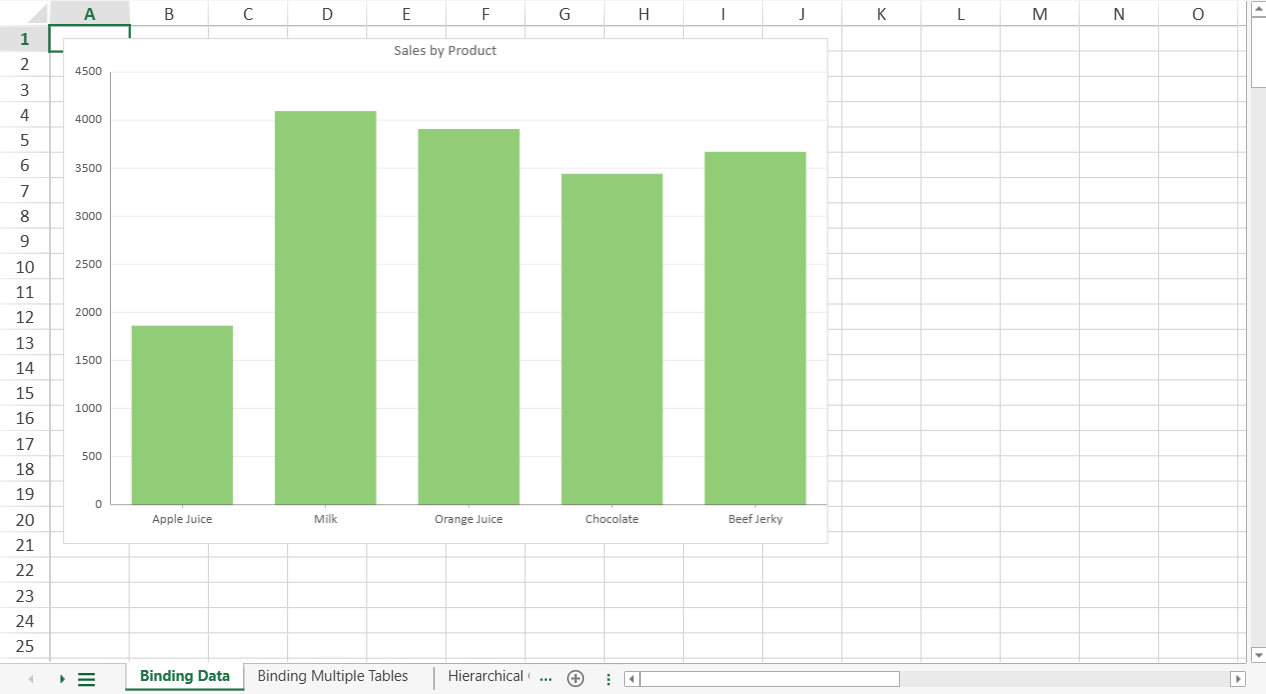
### Step 4 – Basic Data Binding Example
The following example binds a Column chart to the `Sales` table.
```javascript
const sheet = spread.getSheet(0);
sheet.name("Binding Data");
const dataChart = sheet.dataCharts.add('data-chart', 10, 10, 600, 400);
dataChart.setChartConfig({
tableName: 'Sales',
plots: [{
type: GC.Spread.Sheets.DataCharts.DataChartType.column,
encodings: {
values: [{
field: "Sales",
aggregate: GC.Spread.Sheets.DataCharts.Aggregate.sum
}],
category: {
field: "Product"
}
}
}],
config: {
header: {
title: "Sales by Product"
}
}
});
```
### Step 5 – Binding Multiple Tables
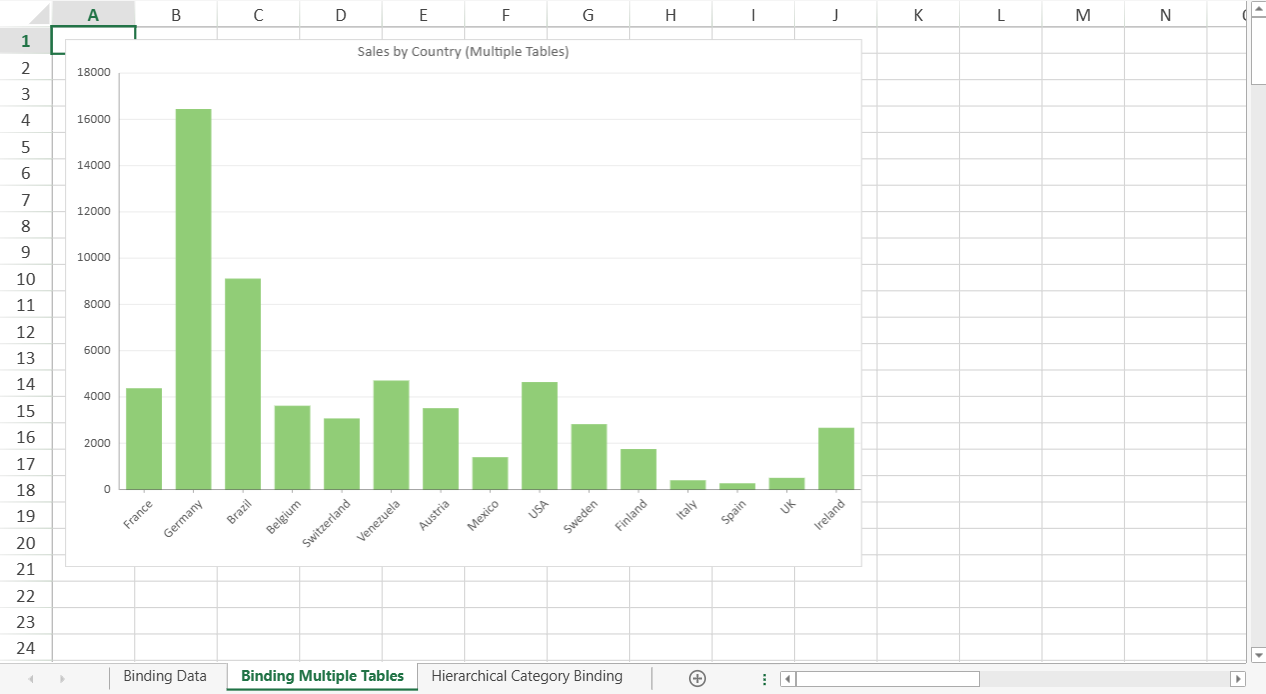
When a relationship exists, fields from related tables can be referenced using a path expression.
The following example binds a chart to the `Orders` table and aggregates data from the related `orderDetailsTable`.
```javascript
let sheet2 = spread.getSheet(1);
sheet2.name("Binding Multiple Tables");
const dataChart2 = sheet2.dataCharts.add('data-chart-2', 10, 10, 600, 400);
dataChart2.setChartConfig({
tableName: 'Orders',
plots: [{
type: GC.Spread.Sheets.DataCharts.DataChartType.column,
encodings: {
values: [{
field: 'orderDetailsTable.Sales'
}],
category: {
field: 'shipCountry'
}
}
}],
config: {
header: {
title: "Sales by Country (Multiple Tables)"
}
}
});
```
### Step 6 – Hierarchical Category Binding
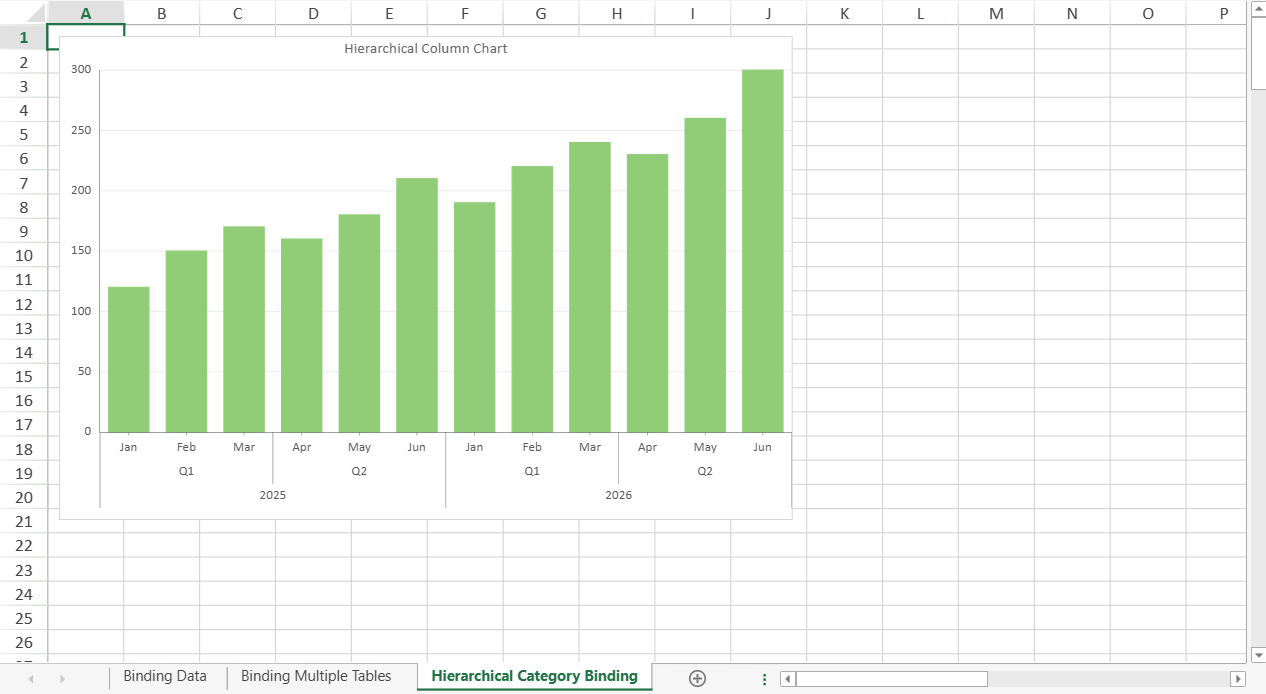
DataCharts support multi-level category grouping by defining nested `child` fields within the `category` encoding.
The following example binds a Column chart using a hierarchical category structure (Year → Quarter → Month).
```javascript
let sheet3 = spread.getSheet(2);
sheet3.name("Hierarchical Category Binding");
const dataChart3 = sheet3.dataCharts.add('data-chart-3', 10, 10, 600, 400);
dataChart3.setChartConfig({
tableName: 'HierarchySales',
plots: [{
type: GC.Spread.Sheets.DataCharts.DataChartType.column,
encodings: {
values: [{
field: 'sales'
}],
category: {
field: "year",
child: {
field: "quarter",
child: {
field: "month"
}
}
}
}
}],
config: {
header: {
title: "Hierarchical Column Chart"
}
}
});
```
### Complete Example
The implementations of the following functions are not shown in this topic:
* `createSalesTable`
* `createOrders`
* `createOrderDetails`
* `createHierarchySalesTable`
Download the complete runnable example, including all table creation utilities:
[BindDataSourceExample.js](https://cdn.mescius.io/document-site-files/attachments/b2223940-43c2-44cf-8eda-f5ab9acd84f0/BindDataSourceExample-20260420.ba27d8.js)