# STDEVP
## Content
This function returns the standard deviation for an entire specified population (of numeric values).
## Syntax
`STDEVP(number1,[number2],...)`
## Arguments
This function has these arguments:
| Argument | Description |
| -------- | ----------- |
| *number1* | [Required] The first number argument corresponding to a population |
| *number2, ...* | [Optional] Number arguments 2 to 255 corresponding to a population. You can also use a single array or a reference to an array instead of arguments separated by commas |
## Remarks
The standard deviation is a measure of how widely values are dispersed from the average value.
The standard deviation is calculated using the "biased" or "n" method.
* The equation for calculating the standard deviation for a population is:
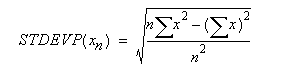
where x is the value and n is the number of values.
This function assumes that its arguments are the entire population. If your data represents a sample of the population, then compute the standard deviation using the [STDEV](/document-solutions/java-excel-api/docs/online/formula-reference/compatibility-functions/stdev) function.
This function differs from STDEVPA, which accepts text or logical values as well as numeric values.
## Examples
`STDEVP(A1,B2,C3,D4,E5,F6)`
`STDEVP(A1:A9)`
`STDEVP(R1C2,R3C4,R4C5,R7C2)`
`STDEVP(95,89,73,87,85,76,100,96,96)` gives the result 8.8079649700